
Overview:
Running automated regression on a daily basis as part of daily build is inevitable nowadays! It is cool to find & report the issues as soon as they are introduced. But it is very painful to maintain hundreds of automated tests & remote parallel execution! Once you have a huge automated regression test suite in place, you might have split it into multiple test suites based on business modules and you might be running them in parallel as part of your daily automated regression. Most of these automated regression suites run in a remote VM and the test results are created / accessible only at the end of the test execution. Otherwise, you might need to look into jenkins console for the test execution results log to see the progress. It might be annoying in certain cases. It might be cool to have an application which gives us the test execution results while the tests are being executed in the remote VMs.
Lets see how we could create a simple test execution results page and a dashboard using InfluxDB & Grafana.
Goal:
We can collect all the possible test metrics like
- Test method status
- Test method duration
- Test class status
- Test class duration
- Test suite status
- Test suite duration
We can derive some of the metrics like below in real time
- test methods count grouped by status (For ex: Pass: 30, Failed: 2, Skipped: 2) on a specific day
- test suite duration trend for the week, month, year etc
InfluxDB:
InflxuDB is a time-series database which is used here to collect all the test metrics. InfluxDB has REST APIs to write data into and query. More info is here. I am using below docker command to run an instance of InfluxDB.
sudo docker run -p 8086:8086 -v $PWD:/var/lib/influxdb influxdb
Creating Database:
We have InfluxDB up and running. Lets create a separate database schema for collecting our selenium test results. I run below command in my terminal to create a db schema called ‘selenium’. [Do check the url here. replace the localhost with the hostname/ipaddress if it is not running in your current machine.]
curl -i -XPOST http://localhost:8086/query --data-urlencode "q=CREATE DATABASE selenium"
TestNG:
Lets create a simple testNG test
public class SampleTest {

    @Test(description = "login")
    public void login(){

    }

    @Test(description = "search for flights", dependsOnMethods = "login")
    public void search(){

    }

    @Test(description = "select flight", dependsOnMethods = "search")
    public void select(){

    }

    @Test(description = "book flight", dependsOnMethods = "select")
    public void book(){

    }

    @Test(description = "logout", dependsOnMethods = "book")
    public void logout(){

    }
}
Our aim here is whenever the test executes, we need to collect the results into the InfluxDB. So, we need a driver/library for InfluxDB in Java.
Maven Dependency:
Add the below maven dependency.
<dependency>
            <groupId>org.influxdb</groupId>
            <artifactId>influxdb-java</artifactId>
            <version>2.12</version>
 </dependency>
Listeners:
TestNG listeners are great for listening to an event and react based on the event occurred. First lets create a simple class which is responsible for sending the results to InfluxDB.
import org.influxdb.InfluxDB;
import org.influxdb.InfluxDBFactory;
import org.influxdb.dto.Point;

public class ResultSender {

    private static final InfluxDB INFLXUDB = InfluxDBFactory.connect("http://localhost:8086", "root", "root");
    private static final String DATABASE = "selenium";

    static{
        INFLXUDB.setDatabase(DATABASE);
    }

    public static void send(final Point point){
        INFLXUDB.write(point);
    }

}
Lets create another class which is implementing ITestListener interface.
import org.influxdb.dto.Point;
import org.testng.ITestContext;
import org.testng.ITestListener;
import org.testng.ITestResult;
import java.util.concurrent.TimeUnit;

public class ExecutionListener implements ITestListener {

    public void onTestStart(ITestResult iTestResult) {

    }

    public void onTestSuccess(ITestResult iTestResult) {
        this.sendTestMethodStatus(iTestResult, "PASS");
    }

    public void onTestFailure(ITestResult iTestResult) {
        this.sendTestMethodStatus(iTestResult, "FAIL");
    }

    public void onTestSkipped(ITestResult iTestResult) {
        this.sendTestMethodStatus(iTestResult, "SKIPPED");
    }

    public void onTestFailedButWithinSuccessPercentage(ITestResult iTestResult) {

    }

    public void onStart(ITestContext iTestContext) {

    }

    public void onFinish(ITestContext iTestContext) {
        this.sendTestClassStatus(iTestContext);
    }

    private void sendTestMethodStatus(ITestResult iTestResult, String status) {
        Point point = Point.measurement("testmethod")
                .time(System.currentTimeMillis(), TimeUnit.MILLISECONDS)
                .tag("testclass", iTestResult.getTestClass().getName())
                .tag("name", iTestResult.getName())
                .tag("description", iTestResult.getMethod().getDescription())
                .tag("result", status)
                .addField("duration", (iTestResult.getEndMillis() - iTestResult.getStartMillis()))
                .build();
        ResultSender.send(point);
    }

    private void sendTestClassStatus(ITestContext iTestContext) {
        Point point = Point.measurement("testclass")
                .time(System.currentTimeMillis(), TimeUnit.MILLISECONDS)
                .tag("name", iTestContext.getAllTestMethods()[0].getTestClass().getName())
                .addField("duration", (iTestContext.getEndDate().getTime() - iTestContext.getStartDate().getTime()))
                .build();
        ResultSender.send(point);
    }

}
Note: use additional ‘tag’ as per your requirements in the above example to categorize your results. For example: tag(“scenario”, “login flow”)
Above listener will monitor the test execution and as soon as a method/test class is executed, it sends the name, duration and few other details. My aim here is to give you just an idea. Modify this as per your requirements.
Now include the listener in the suite xml or in the base TestNG class.
<suite name="My suite">
    <listeners>
        <listener class-name="com.tag.realtime.ExecutionListener" />
    </listeners>
    <test name="Test1">
        <classes>
            <class name="com.tag.realtime.SampleTest"/>
        </classes>
    </test>
    <test name="Test2">
        <classes>
            <class name="com.tag.realtime.Sample2Test"/>
        </classes>
    </test>
</suite>
or
@Listeners(ExecutionListener.class)
public class SampleTest {

    @Test
    public void test(){

    }

}
Grafana:
We have achieved to send results to InfluxDB which is great so far. How to query the results and visualize the data!? We would be using another free tool called ‘Grafana’.
Grafana is an excellent data visualization tool for time-series data and nicely integrates with InfluxDB. I am running below docker command to create an instance of Grafana. [piechart plugin is optional in the command. you can remove if you do not need]
docker run -d -p 3000:3000
  --name=grafana \
  -e "GF_INSTALL_PLUGINS=grafana-piechart-panel" \
  -v $PWD:/var/lib/grafana \
  grafana/grafana
Grafana Data Source:
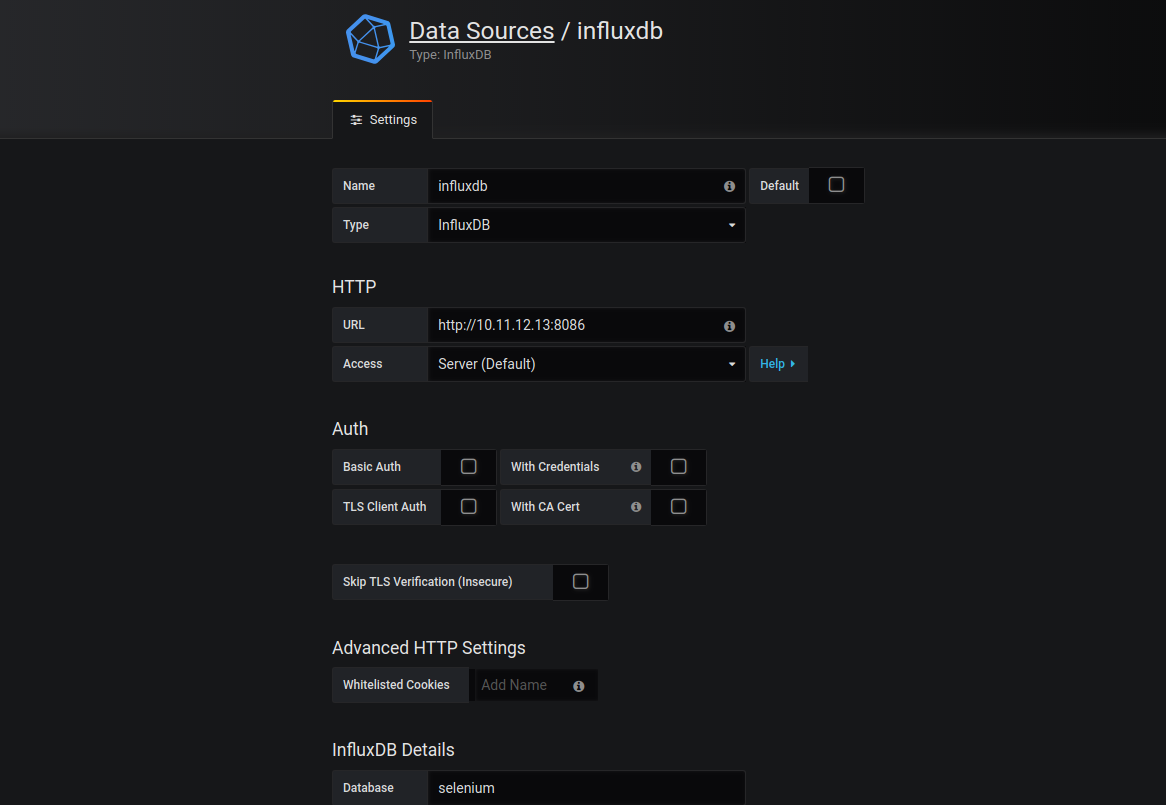
Go to Settings -> Data sources -> Add new data source as given here. Click on ‘Save & Test’ button to ensure that Grafana is able to talk to InfluxDB.
Note: If you are using docker for Grafana & access as ‘Server default’, do NOT use localhost in the HTTP URL for the influxdb source. It is because – here localhost is grafana container – Not your actual machine. So, grafana container can not find influxdb.
Creating Dashboard:
I would like you to check this video as explaining everything through this article would be difficult. So I have created this video for you.
Demo 2:
Summary:
I hope setting up real time results using InfluxDB and Grafana was an interesting & fun project for you. It requires only very minimal change in your existing framework as we use TestNG listeners. Removing the listener from the suite file / base class is just fine to disable the feature in case you do not like it. This set up could avoid a lot of team’s frustration if they are currently monitoring the results via console output / logging into the remote machine for results analysis. This article gives only a high level idea. You could further enhance this by including more info like test environment, add additional filters to refresh the charts data for specific test environment / tests etc.
Happy Testing & Subscribe 🙂
Big thank you!
How would you use this in cucumber
What framework/runner you use – testNG/junit?
Thanks Vinoth for posting this, I was searching for content to integrate cucumber BDD with grafana, I have used the above docker command to download the grafana with pie chart plugin install, But the pie chart is not found on the dashboard, seems the plugin install is failing, can you please suggest.