


Overview:
Running automated regression on a daily basis as part of daily build is inevitable nowadays! It is cool to find & report the issues as soon as they are introduced. But it is very painful to maintain hundreds of automated tests & remote parallel execution! Once you have a huge automated regression test suite in place, you might have split it into multiple test suites based on business modules and you might be running them in parallel as part of your daily automated regression. Most of these automated regression suites run in a remote VM and the test results are created / accessible only at the end of the test execution. Otherwise, you might need to look into jenkins console for the test execution results log to see the progress. It might be annoying in certain cases. It might be cool to have an application which gives us the test execution results while the tests are being executed in the remote VMs.
Lets see how we could create a simple test execution results page and a dashboard using ElasticSearch & Kibana.
Elasticsearch:
ElasticSearch is basically a document storage and a Search Engine which exposes REST API for storing and retrieving results based on our query. More info on Elasticsearch is here. To setup Elasticsearch, use docker or check the installation page on the Elasticsearch site for the instructions for your OS.
docker run -p 9200:9200 -p 9300:9300 -e "discovery.type=single-node" docker.elastic.co/elasticsearch/elasticsearch:6.2.2
Kibana:
Kibana is a front-end application for Elasticsearch. It is basically a data visualization tool for your elasticsearch data. More info on Kibana is here. To setup kibana using docker,
docker run -p 5601:5601 -e ELASTICSEARCH_URL=http://[IP where elasticsearch is running]:9200 docker.elastic.co/kibana/kibana:6.2.2
Maven POM Dependencies:
I love Java & I have included below dependencies in my Maven pom file for the sample code I have included in this article. For other programming languages, continue reading this article to get an idea. This real time results setup can be done for any programming language. It is NOT specific to Java.
<dependency>
        <groupId>org.testng</groupId>
        <artifactId>testng</artifactId>
        <version>6.14.2</version>
    </dependency>
    <dependency>
        <groupId>com.fasterxml.jackson.core</groupId>
        <artifactId>jackson-databind</artifactId>
        <version>2.9.4</version>
    </dependency>
    <dependency>
        <groupId>com.mashape.unirest</groupId>
        <artifactId>unirest-java</artifactId>
        <version>1.4.9</version>
    </dependency>
Sample Test Class:
Lets create a simple test class as shown here.
public class SampleTest {

    @Test(description = "login")
    public void login(){

    }

    @Test(description = "search for flights", dependsOnMethods = "login")
    public void search(){

    }

    @Test(description = "select flight", dependsOnMethods = "search")
    public void select(){

    }

    @Test(description = "book flight", dependsOnMethods = "select")
    public void book(){

    }

    @Test(description = "logout", dependsOnMethods = "book")
    public void logout(){

    }
}
As soon as a test method is complete, I would like to get the status. Basically, I am looking for below information.
- Name of test class is being executed
- Name of the test method / description
- Status of the test method (PASS / FAIL / SKIPPED)
- Execution Date and Time.
So, Lets assume that our JSON structure to send the data to Elasticsearch would be more or less as shown here.
{
   "testClass":"com.tag.realtime.SampleTest",
   "description":"login",
   "status":"PASS",
   "executionTime":"2018-03-10T14:18:40.369"
}
You might want to include more info – like Test Environment (DEV, QA, STAGING, PROD), assertion results, exception details etc. Create a sample JSON file to get an idea and the information you want to send to Elasticsearch. Once you are done with your JSON structure, Lets create a simple class as shown below. This class is responsible for getting the information we would like to see in real time. This class instance would be serialized into a JSON using Jackson library.
public class TestStatus {

    @JsonProperty("testClass")
    private String testClass;

    @JsonProperty("description")
    private String description;

    @JsonProperty("status")
    private String status;

    @JsonProperty("executionTime")
    private String executionTime;

    public void setDescription(String description) {
        this.description = description;
    }

    public void setExecutionDate(String executionTime) {
        this.executionTime = executionTime;
    }

    public void setStatus(String status) {
        this.status = status;
    }

    public void setTestClass(String testClass) {
        this.testClass = testClass;
    }

}
Once we build our JSON, we need to post it into our Elasticsearch instance. Elasticsearch exposes REST APIs. I am creating another simple Java class ResultSender to convert above Java class to a JSON string and insert that into our Elasticsearch instance.
public class ResultSender {

    private static final ObjectMapper OM = new ObjectMapper();
    private static final String CONTENT_TYPE = "Content-Type";
    private static final String CONTENT_TYPE_VALUE = "application/json";
    private static final String ELASTICSEARCH_URL = "http://localhost:9200/app/suite";

    public static void send(final TestStatus testStatus){
        try {
            Unirest.post(ELASTICSEARCH_URL)
                    .header(CONTENT_TYPE, CONTENT_TYPE_VALUE)
                    .body(OM.writeValueAsString(testStatus)).asJson();
        } catch (Exception e) {
            e.printStackTrace();
        }
    }

}
Now we are ready with building JSON file and posting into our Elasticsearch instance. We still need a listener between our test class and ‘ResultSender’ – which is responsible for monitoring the test execution and calling the ‘ResultSender’ to send the results as soon as a test method is complete. So, Lets create a listener class as shown below.
public class ExecutionListener implements ITestListener {

    private TestStatus testStatus;

    public void onTestStart(ITestResult iTestResult) {
        this.testStatus = new TestStatus();
    }

    public void onTestSuccess(ITestResult iTestResult) {
        this.sendStatus(iTestResult,"PASS");
    }

    public void onTestFailure(ITestResult iTestResult) {
        this.sendStatus(iTestResult,"FAIL");
    }

    public void onTestSkipped(ITestResult iTestResult) {
        this.sendStatus(iTestResult,"SKIPPED");
    }

    public void onTestFailedButWithinSuccessPercentage(ITestResult iTestResult) {
        //skip
    }

    public void onStart(ITestContext iTestContext) {
        //skip
    }

    public void onFinish(ITestContext iTestContext) {
        //skip
    }

    private void sendStatus(ITestResult iTestResult, String status){
        this.testStatus.setTestClass(iTestResult.getTestClass().getName());
        this.testStatus.setDescription(iTestResult.getMethod().getDescription());
        this.testStatus.setStatus(status);
        this.testStatus.setExecutionDate(LocalDateTime.now().toString());
        ResultSender.send(this.testStatus);
    }

}
Add the listener on your test classes as shown here. If you have multiple test classes, you could include the listener in the test suite file instead of adding ‘@Listeners’ for each and every test classes.
@Listeners(ExecutionListener.class)
public class SampleTest {
    // test methods
}
Now everything seems to be ready to send some data to Elasticsearch. Run the test and ensure that you do not get any exception due to the above setup. If everything is fine, access Kibana UI using below URL.
http://localhost:5601
Kibana – Creating Index Pattern:
Before we perform any search, It is necessary to create an index pattern in Kibana. Go to Management tab and create an index pattern as shown here.
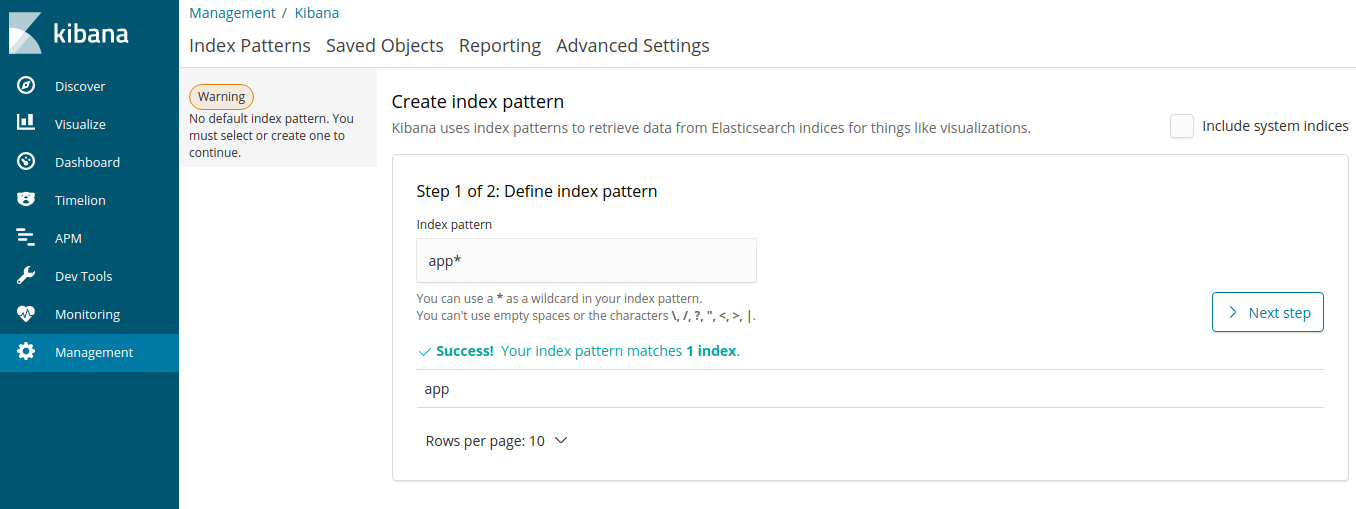

Click on the Next Step
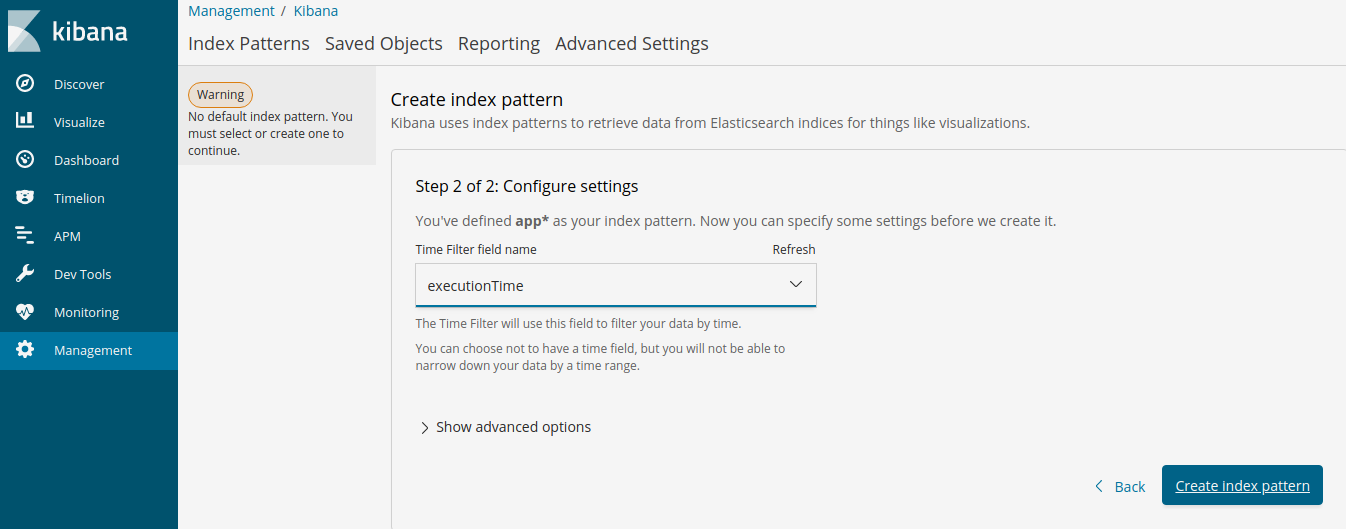

Click on the ‘Create Index Pattern’.
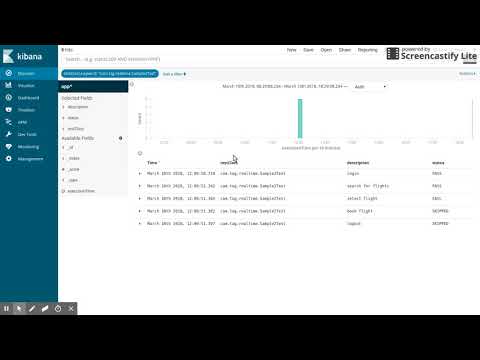
Kibana – Discover Tab:
We can get the test method execution results in the discover tab. Kibana would have already queried Elasticsearch for the results based on the index pattern we had created.
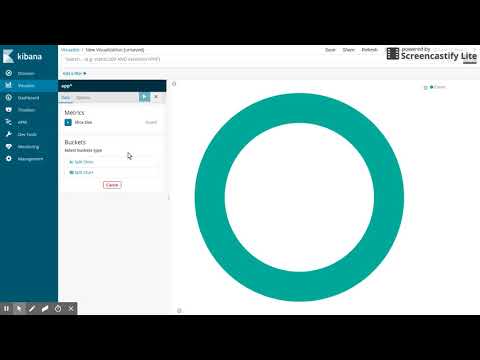
Kibana – Visualize Tab:
To create a dashboard with some test execution results, lets create few visualizations.
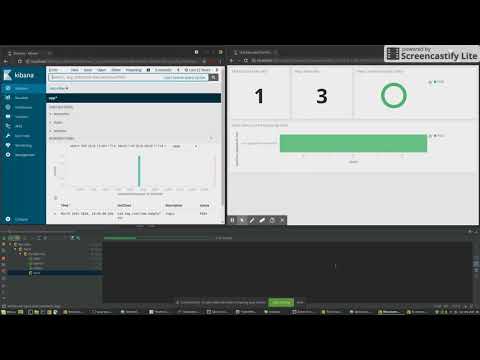
Kibana – Dashboard Tab:
Lets finally create the dashboard which gives us the real time results while tests are being executed.

End-To-End Verification:
Lets do one final verification to ensure that everything works and we could get real time results while the tests are being executed. Kibana is set to refresh every 5 seconds. So, there will be a 5 seconds delay in worst case scenario which is OK.
Summary:
Setting up real time results using Elasticsearch and Kibana is very easy. It requires only very minimal change in your existing framework. This set up could avoid a lot of team’s frustration if they are currently monitoring the results via console output / logging into the remote machine for results analysis. This article gives only a high level idea. You could further enhance this by including more info like test environment, assertion results, add additional filters to refresh the charts data for specific test environment / tests etc.
Happy Testing & Subscribe 🙂