

We have already seen monitoring CPU / Memory utilization using Collectd (this article). But It does not give all the information to identify the bottleneck of a Performance issue. In this article, we will be using Collectd Java plugin to monitor and manage Java Virtual Machine (JVM) using its JMX technology.
Goal:
To monitor and manage the Java Virtual Machine (JVM) using Java’s JMX technology.
Architecture:
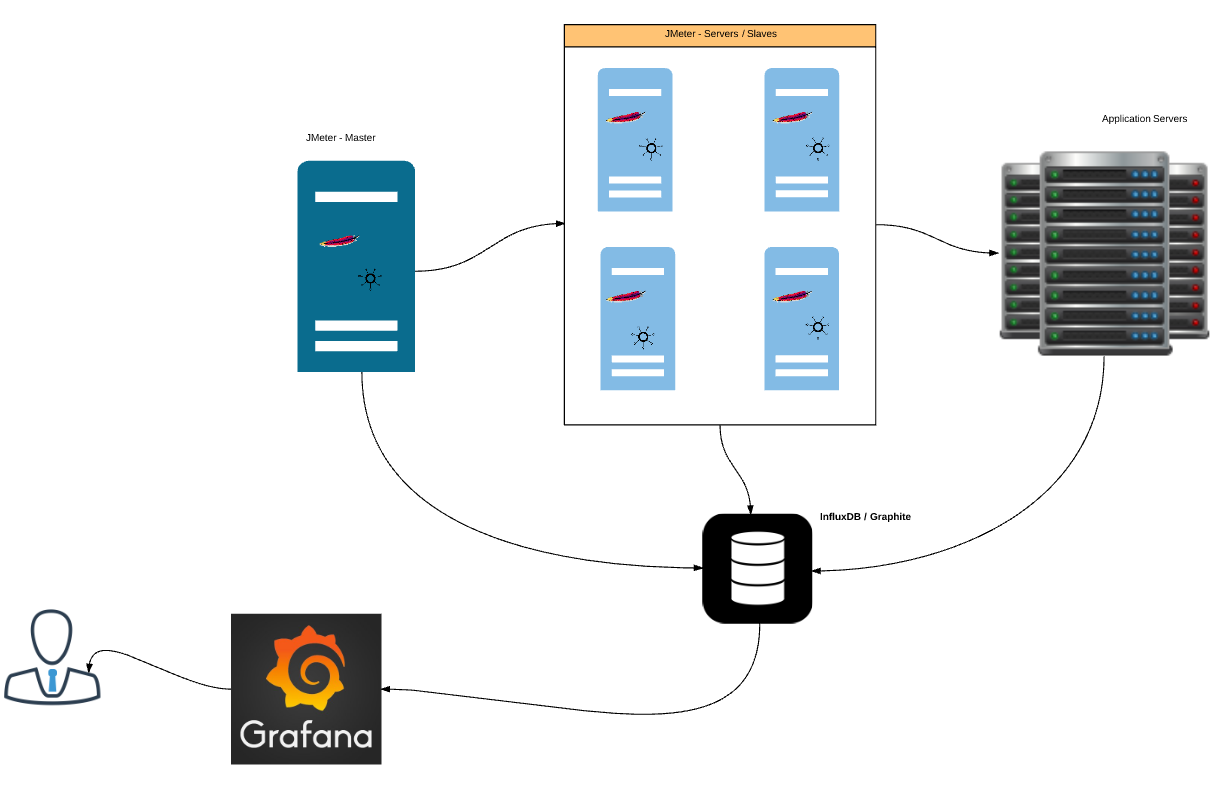
Our high level architecture will be as shown here – We will be monitoring JVM of all our app servers, JMeter-servers and JMeter-master.

JMX (Java Managed Extensions):
JMX was introduced in Java 5.0 release to manage / monitor the resources at run time. Using JMX, We will be able to monitor memory usage, garbage collection, loaded classes, thread count etc over time. This is more useful information in Performance Engineering. More Info is here.

As the above picture shows, using the JMX connector, clients like JConsole/Collectd talks to the MBean server to get the metrics of the application we are interested in.
JConsole:
JConsole is a GUI tool to monitor JVM. It comes with Java JDK. Let see how it can help us with monitoring JMeter. [I assume you have JDK installed]
- Launch JMeter
- Open a simple test plan / create one.
- Go to Java JDK Home / bin folder
- Launch JConsole.exe
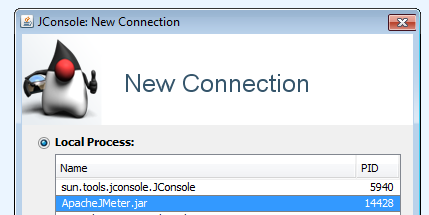

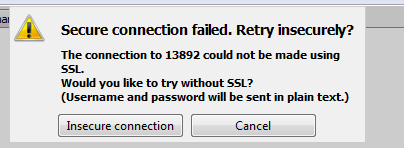
- It will show the list of Java applications running. Select ApacheJMeter.jar & connect. If you get this dialog window, click on ‘Insecure Connection’

- Run the JMeter test.
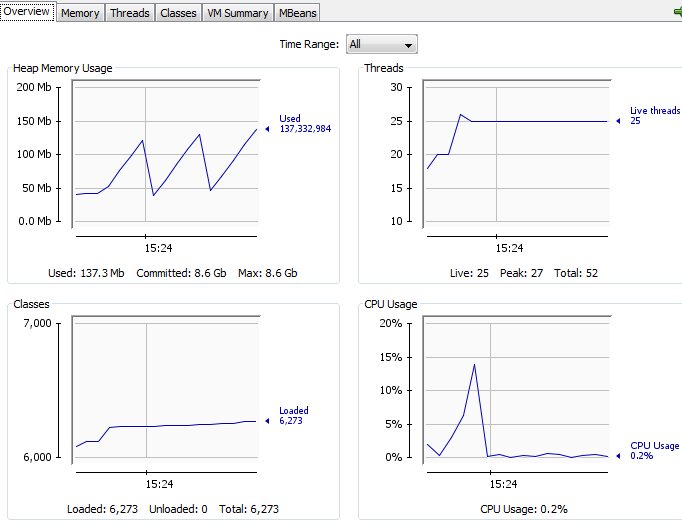

- JConsole shows the memory usuage, thread count [Not to be confused with JMeter’s thread count], loaded classes etc
- Individual tabs provide more information like GC.
Monitoring Remote Process:
- As we monitored above for the local process (ApacheJMeter.jar), JConsole can be used to monitor the remote process as well (The remote process could be your tomcat server / JMeter-server)
- Certain properties should be set for the remote process, so that the client/JConsole can talk to the JMX API to get the information. While launching the java process, pass below properties.
-Dcom.sun.management.jmxremote

-Dcom.sun.management.jmxremote.port=6969

-Dcom.sun.management.jmxremote.rmi.port=6969

-Dcom.sun.management.jmxremote.ssl=false

-Dcom.sun.management.jmxremote.authenticate=false
- In case, if you are running docker container, ensure that the below property is also used.
-Djava.rmi.server.hostname=${HOST_IP}
- To collect jmeter-server jmx metrics, I set below environment variable & start jmeter-server.sh
export JVM_ARGS="-Dcom.sun.management.jmxremote -Dcom.sun.management.jmxremote.port=6969 -Dcom.sun.management.jmxremote.rmi.port=6969 -Dcom.sun.management.jmxremote.ssl=false -Dcom.sun.management.jmxremote.authenticate=false"
- For Tomcat:
CATALINA_OPTS="-Dcom.sun.management.jmxremote -Dcom.sun.management.jmxremote.port=6969 -Dcom.sun.management.jmxremote.rmi.port=6969 -Dcom.sun.management.jmxremote.ssl=false -Dcom.sun.management.jmxremote.authenticate=false"
- Simply pass the above arguments to the java process to enable JMX monitoring.
- Now JConsole can connect to the remote JMX using the below service URL.
service:jmx:rmi:///jndi/rmi://hostname:6969/jmxrmi
Collectd Java Plugin:
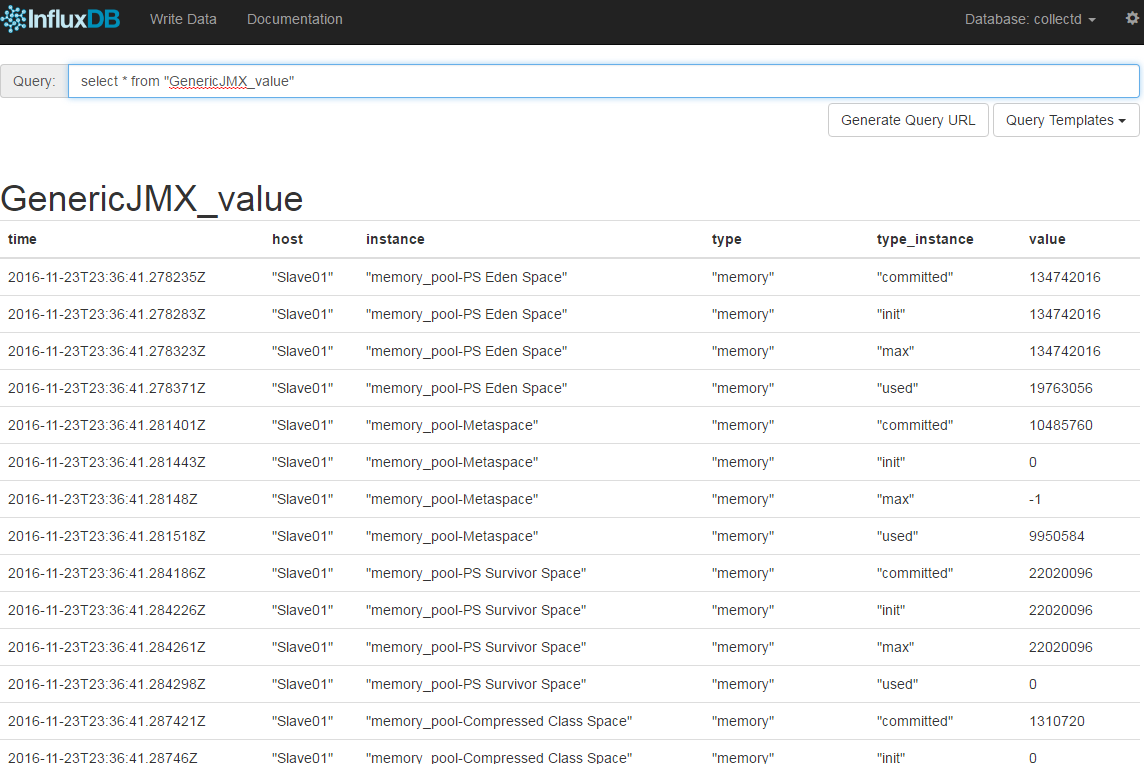
JConsole is a nice tool. But it does not maintain historical data. We already use Collectd to monitor CPU & Memory utilization of our jmeter-servers & app servers. There are Java & JMX plugins for Collectd, which we could use, to collect JMX metrics into InfluxDB.
Please read this article first on collectd usage.
I am going to add below section in the collectd config file.
Restart the collectd service. Wait for few minutes to collect some metrics.

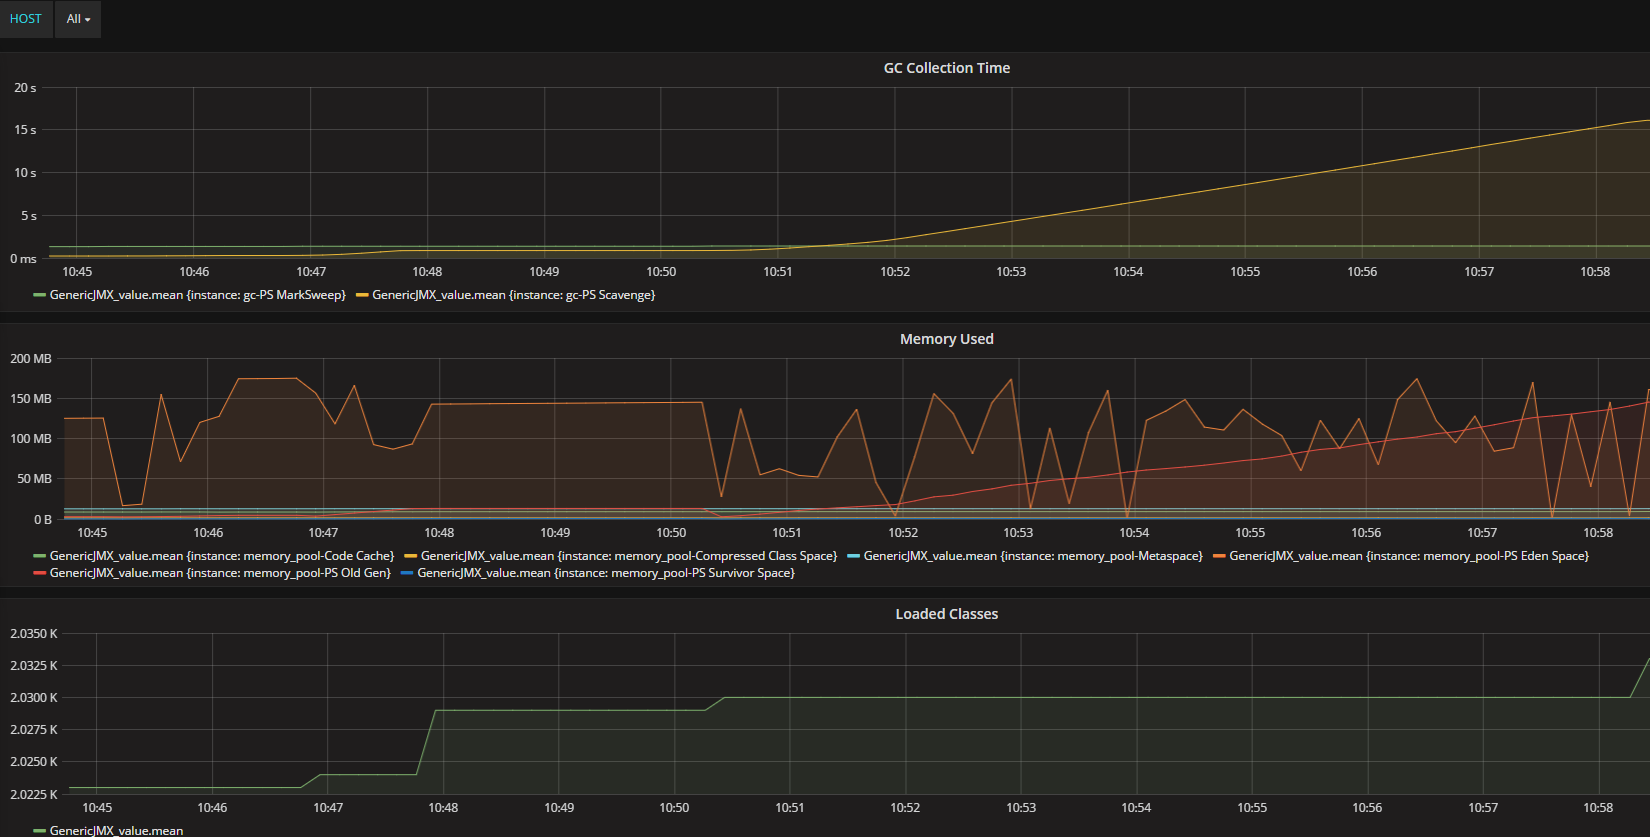
Once you have this data, then last step would be create a dashboard in Grafana to create graphs.

Summary:
Using Collectd plugins, along with CPU & Memory utilization, we can also collect JMX metrics into InfluxDB. Using Grafana, We can visualize, performance test results (min, max, avg response times, througput etc), JMX metrics (heap memory usages, loaded classes count, thread count, GC) & other metrics like CPU & Memory utilization of all the JMeter servers, App servers.
Happy Testing & Subscribe 🙂