

We already have seen in this article on monitoring server performance using JMeter plugin. Even though the JMeter Server agent is useful to collect the server performance metrics, we need to use JMeter’s metrics collector to listen to the server agent to collect the data which was a little bit annoying.
I was looking for some nice way to collect the data into InfluxDB. Along with application server behavior, I also wanted to collect our load generators/JMeter-servers behavior as well. This is very important – because, during the test their CPU utilization should not be above 80%.
We already write our performance test results in InfluxDB (More information on this is here). So if we could get all other information (like server performance stats) as well into InfluxDB, then we can use Grafana dashboard to check all the metrics in one place which would be really cool.
Goal:
To collect all the performance test related metrics (test results + server metrics) while we run the performance test using JMeter
- Application Server’s behavior
- CPU Utilization
- Memory utilization etc
- Performance Test Metrics
- Response Time
- Throughput etc
- Load generators – machine performance metrics
- CPU utilization
- Memory utilization etc
Collectd:
JMeter server-agent does not send the data to the DB directly unless we modify the source code & come up with our own implementation. So, We will be using Collectd which will be running as the daemon to collect server metrics. Collectd is very lightweight, written in C, has huge list of plugins.
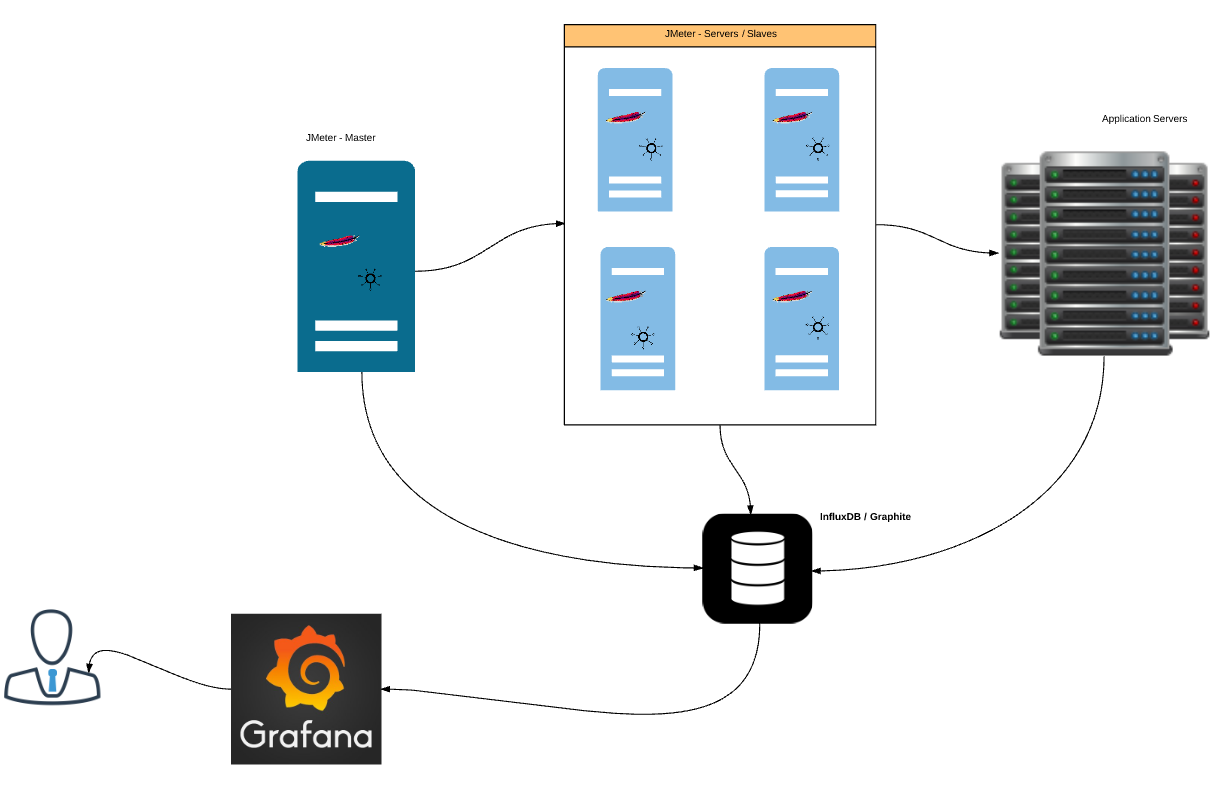
High Level Architecture:

InfluxDB Configuration:
- Follow the detailed steps here for the InfluxDB installation.
- Once it is installed, open the configuration file, enable the below collectd section.
- In the above config file, you might not find the types.db config file in your machine (usually it comes with collectd install. In my case, InfluxDB is running in a different machine. I would not have this file in the machine). So you can get it from here.
- Once everything is configured, launch/restart Influxdb for the new config changes to take effect. [Please ensure that the appropriate ports are open]
- Create a new database for collectd as mentioned in the config here.
Collectd Installation & Configuration:
Collectd itself has a nice wiki page with all the info you would need, including the installation steps. I am going to share the steps I did for my Ubuntu server. For your OS, I would request you to check here for the installation.
 sudo apt-get update

 sudo apt-get install -y collectd
After installing collectd, we need to configure it to send the data to InfluxDB. This is done by updating the collectd config file which could be found in /etc/collectd/collectd.conf.
If you open the file, you will see there are many plugins listed (mostly commented/not enabled) . Each and every plugin listed here is to collect different stats. As part of this article, We are interested in collecting only CPU & Memory utilization.
To send the data to InfluxDB, you need to enable network plugin, provide Influxdb server and port details as shown here.
CPU & Memory utilization alone might not be enough to understand the performance issue. Our aim here is to see how to set up & get some metrics. Once this is done, then we can play with the collectd config to get more information.
Collectd, by default, gives the CPU utilization per core in units of jiffies. Not in %. I wanted the overall CPU utilization in %. That is why I explicitly set certain properties as false.
I set the Interval as 10 to get the CPU utilization for every 10 seconds.
Restart collectd for the new config changes to take effect.
sudo service collectd restart
Repeat the above Collectd Installation & Configuration steps for all the machines where you need to collect the metrics (JMeter master, slaves & the application under test).
Wait for few minutes & check the InfluxDB to see the list of measurements created under the database ‘collectd’.
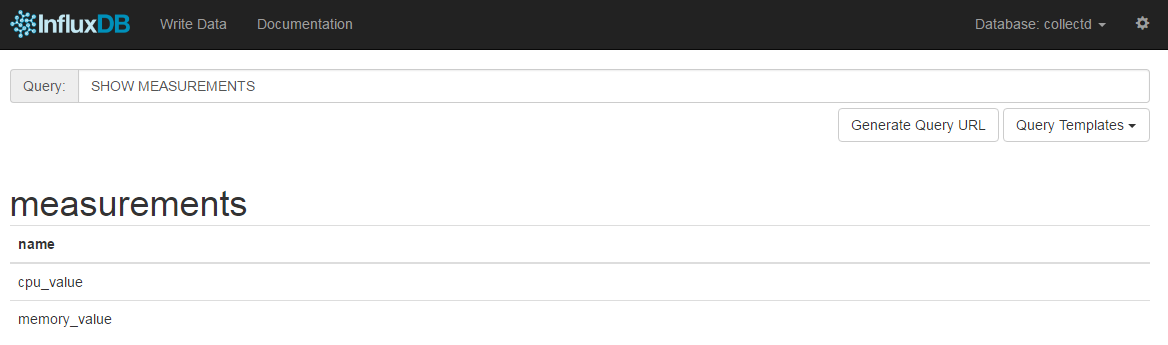

You should be able to see the above measurements after few minutes.
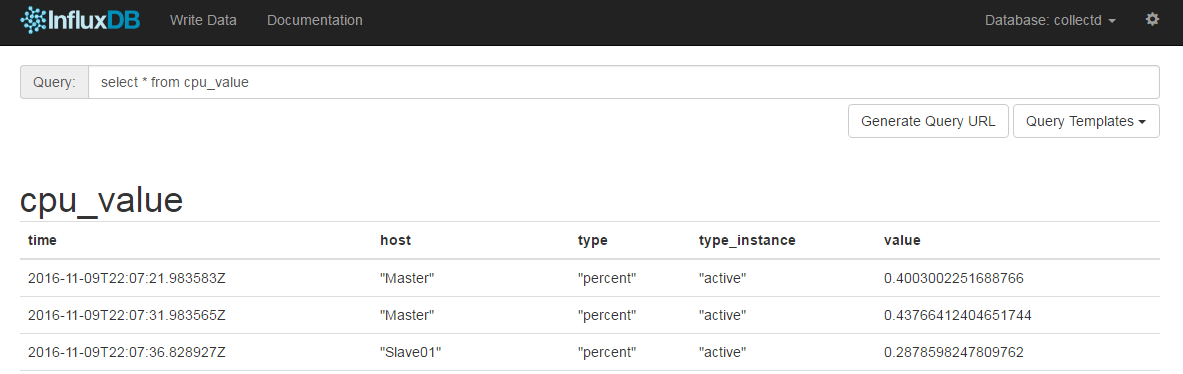
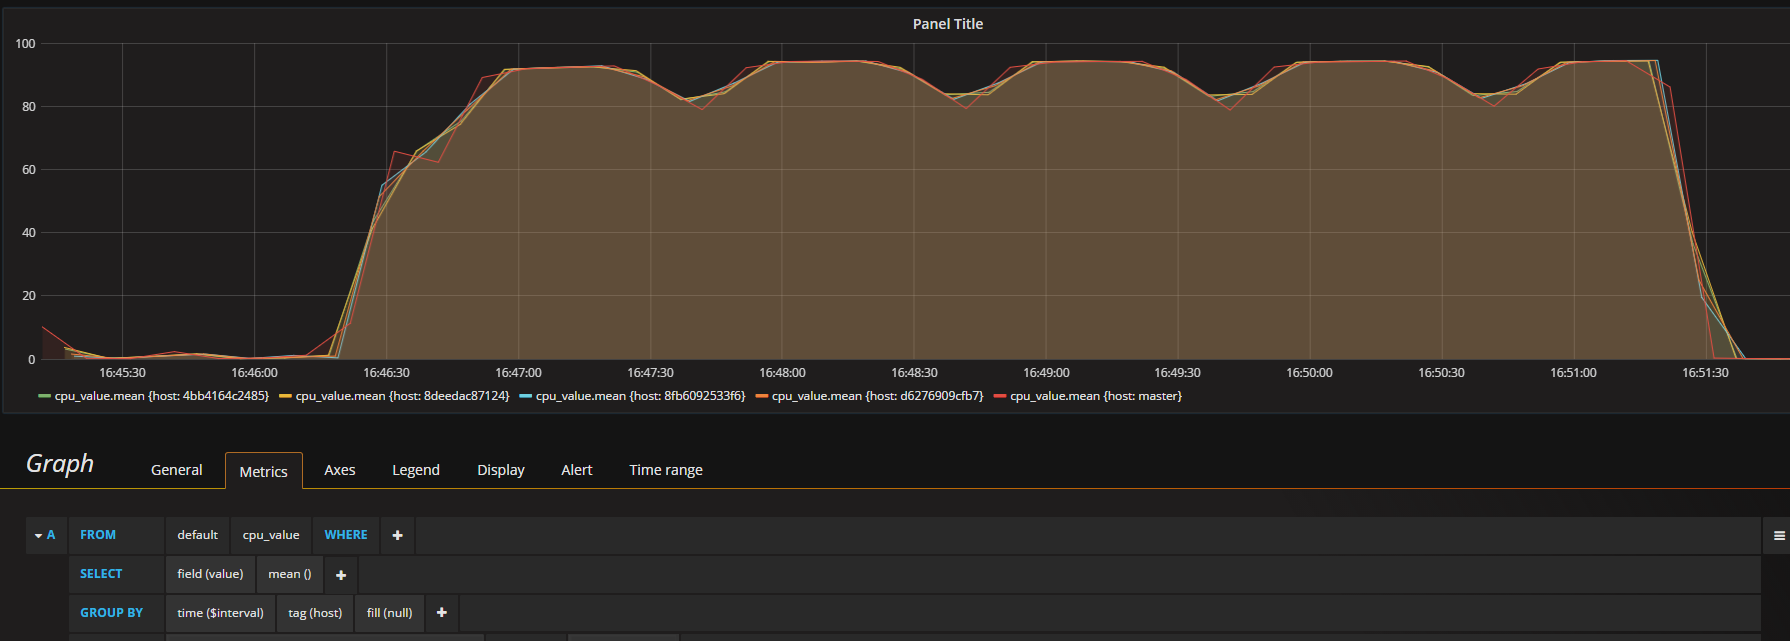
If we query cpu_value measurement, we can see the stats for all the machines.

If you do not see any measurements under the collectd DB, then check the following.
- Check if InfluxDB is running fine
- Check if ports are open
- Check if InfluxDB server time matches with other machine’s time
- Check if Collectd daemon is running
- InfluxDB Troubleshooting
- Collectd Troubleshooting
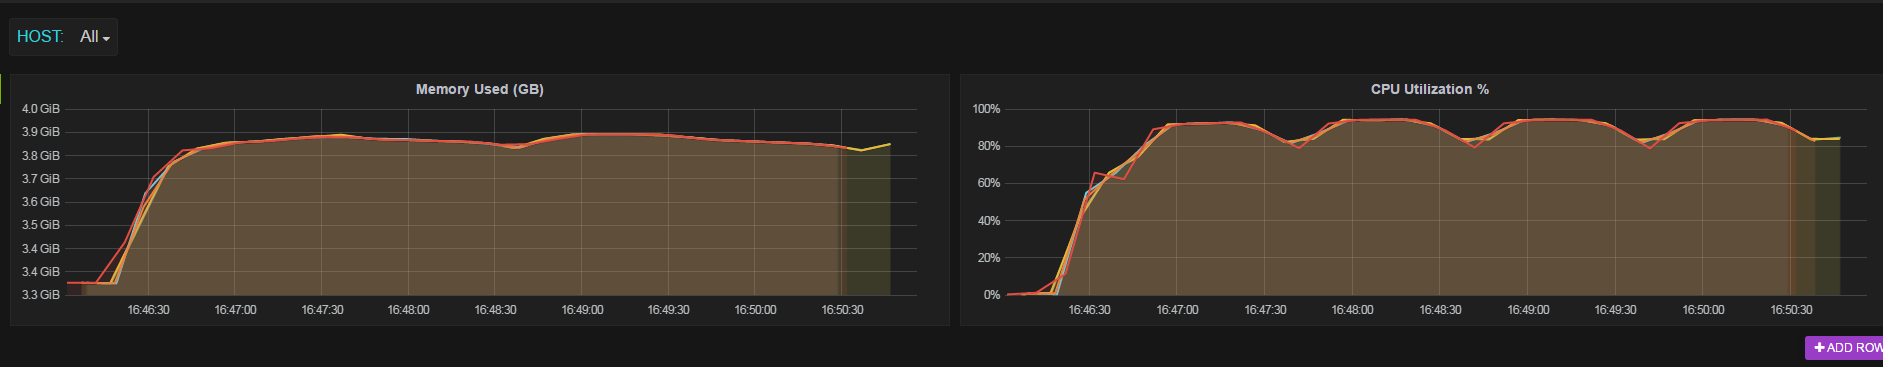
Grafana Dashboard:
Once we have all the data in InfluxDB, the rest is very simple!
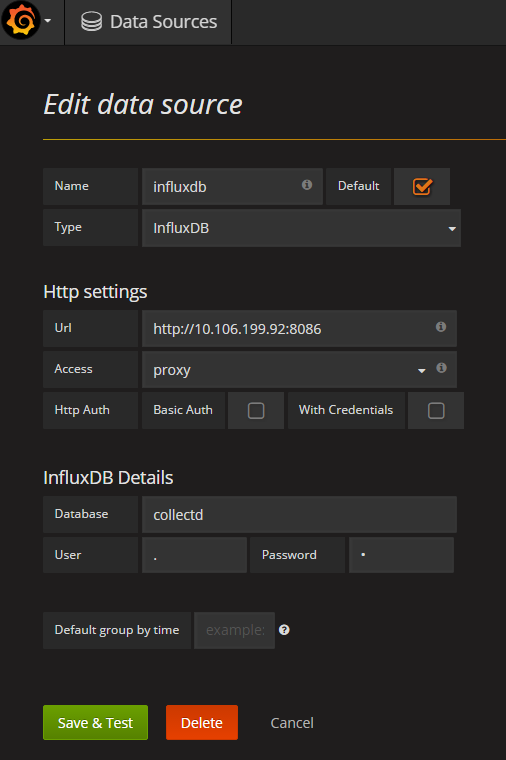
Configure Grafana Datasource.

Create a new, simple, dashboard in Grafana.

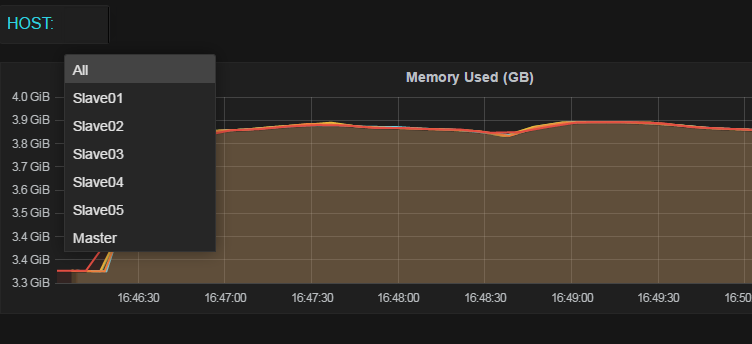
Under Grafana Dashboard settings ‘Templating’, create a new variable called HOST – to filter specific host if you want. This is optional.
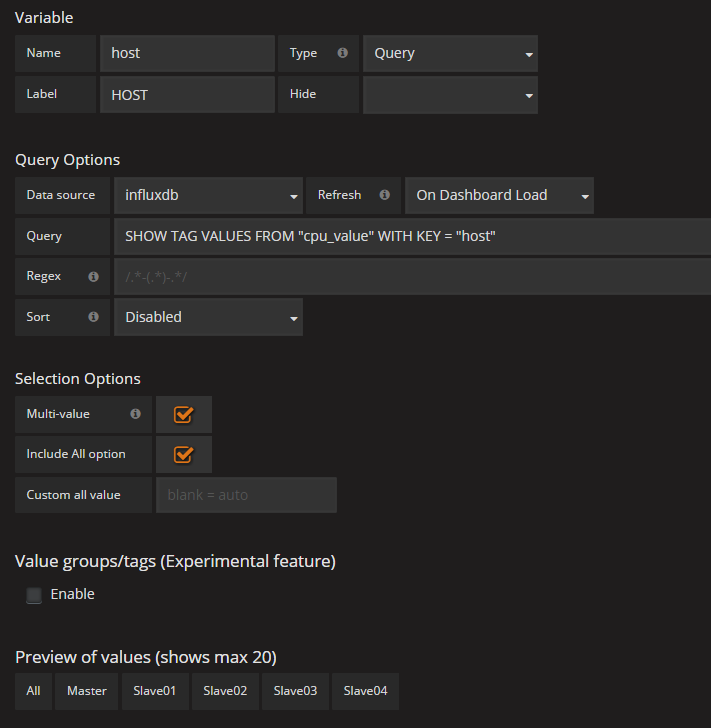

We can use this template variable to filter specific host metrics.
Query:
SELECT mean("value") FROM "cpu_value" WHERE "host" =~ /^$host$/ AND $timeFilter GROUP BY time($interval), "host" fill(null)


Summary:
Collectd, a lightweight daemon, collects all the system performance metrics in InfluxDB. By using Grafana, We can see the performance test results, load generators CPU/Memory utilization, Application under test CPU/Memory utilization etc in one place. As I had already mentioned, CPU/Memory utilization does not provide all the information to find the bottleneck for the poor performance of the application. However if we could set this up properly, then by playing with collectd config, we can get all the information as well. For ex; Java GC details which could provide extremely useful information. You can check that here.
Happy Testing & Subscribe 🙂