

JMeter has many listeners which provide useful information like
- Number of the requests processed
- Average response time
- Throughput
- 90% line
- Error % etc
But….What about the server performance metrics? like CPU / Memory utilization.
JMeter is not only generating the load on the server but also comes with an agent which can run on the server machine to collect the server performance metrics.
In this article, lets see how the Server Performance Metrics Collector works.
Install Server Agent:
For JMeter Version V2.13 or below
- Download the latest server agent from JMeter-Plugins.
- Unzip this file. Place the entire folder in some location on the server.
- Server should have Java JRE to run this server agent.
- Install Java Runtime Engine.
- Java bin should be included in the PATH (environment variables)
- You need to open the port 4444 (default) on the server machine.
- Start the startAgent.bat/startAgent.sh
- startAgent.bat –tcp-port 5555 (if you need to use different port, pass the port as argument).
It would be very simple if the server machine has Java already. The agent has started running at this point.
PerfMon Metrics Collector:
To listen to the agent running on the server, JMeter has a separate listener called – PerfMon Metrics Collector. It is available as part of jmeter-plugins Standard Set. We also have a Plugin Manager for JMeter for easy plugin installation.
- Download the latest standard set from jmeter-plugins.
- Unzip the file content. Copy the lib folder & paste it under JMETER_HOME.
- Restart JMeter
- Now you should see jp@gc – PerfMon Metrics Collector under Listeners.
OR
- Use Plugin Manager to install PerfMon plugin which is responsible for collecting the metrics.
That’s it. Lets try this set up.
Test the Agent & Metrics collector:
- I have a tomcat server running in my machine on the port 8080.
- I created a simple JMeter test to generate some load on the tomcat server. [I know it is not good idea to run the server & load generator on the same machine. But our aim here is to see how it works]
- Server agent is running on the port 4444.
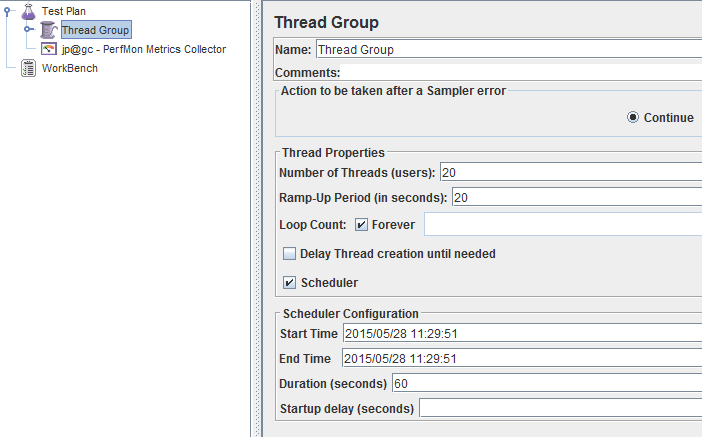
JMeter Test:
Listener:
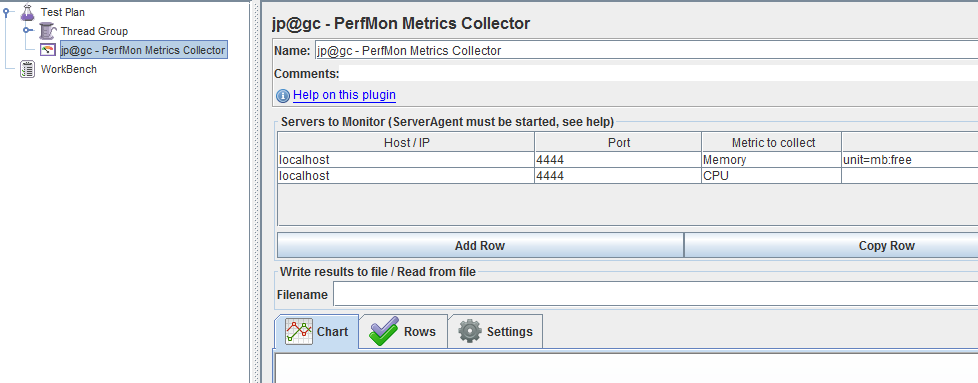
- Host/IP –> Host or IP address of the system where the agent runs.
- Port –> Port through which listener can talk to server agent.
- Metric to Collect –> CPU, Memory, Disks I/O…etc [It is a drop down. Select the metric you are interested in]
- Metric Parameter –> Specific parameter in case of any for the Metric. [For ex: I was interested in collecting only the free memory while running the load test]
- If you need to collect the metric for a specific process, update the process ID. For ex: pid=4008
Now everything is ready to test! Start the JMeter test.
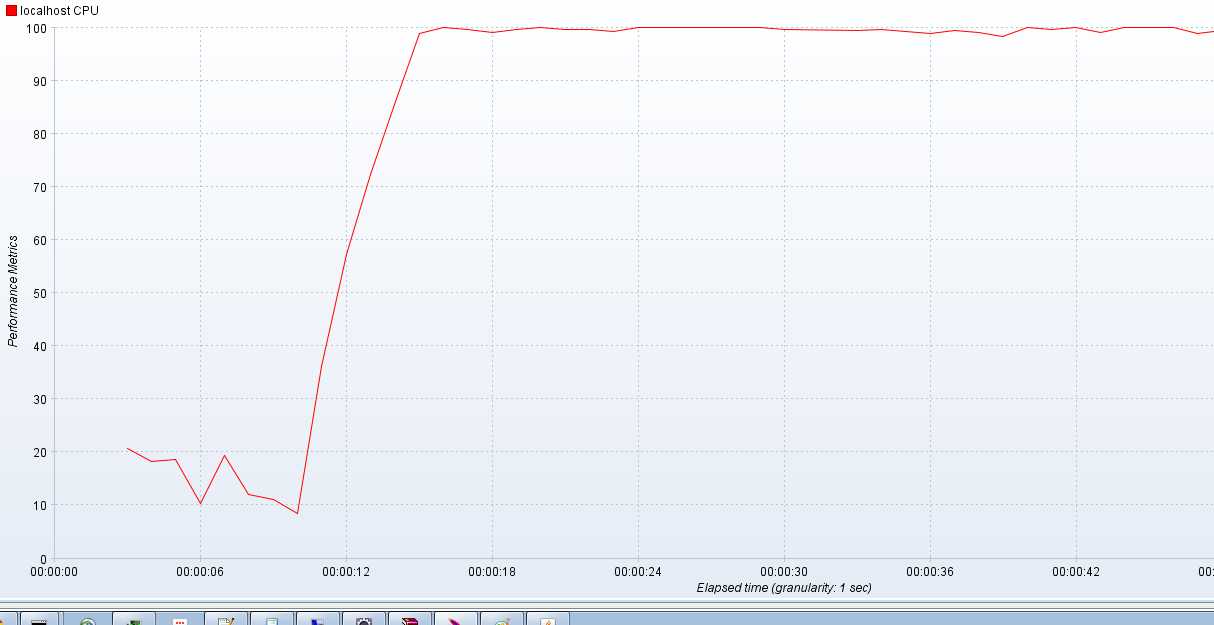
CPU Utilization %:
During my test on the tomcat server, the CPU utilization of the server machine was as given below – for 20 users, the machine started using 100% of CPU.
Next time you do your load testing, other than Response Time, Median, Throughput etc, start measuring Memory & CPU utilization as well with JMeter listeners.
Non-GUI Mode:
If you run JMeter in non GUI mode and want to save monitoring data to file, just configure result file saving in GUI as you do with other listeners. After running the test you may load saved file into GUI and see the values timeline. For more details, please visit.
InfluxDB + Grafana:
If you would like to use InfluxDB + Grafana dashboard for these metrics, please check this article.
Happy Testing & Subscribe 🙂