

Overview:
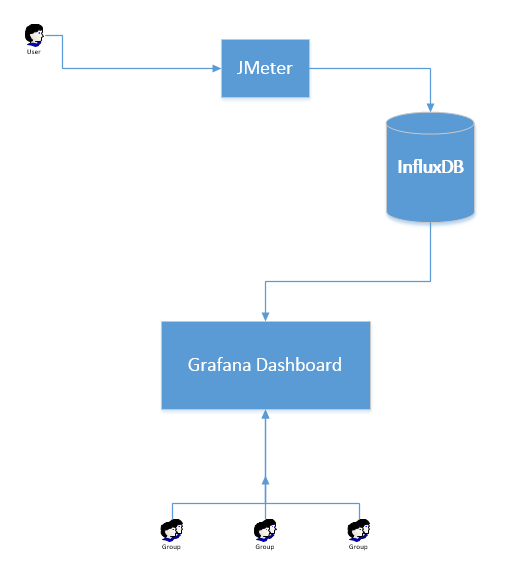
In this article, I will explain how we could get real time performance test results using JMeter + InfluxDB + Grafana.
Please do note that this topic is too huge to cover everything in one article. So, I have tried to provide links to other articles of TestAutomationGuru which could be related to this article. Please check everything if possible.
Problem Statement:
When I used to run my JMeter test many years ago, I was unable to understand the performance of the application during the test execution. I always had to wait for the test to complete. It was little bit annoying – especially during long running tests. Sometimes, I might have to run the soak test for 2/3 days continuously.
At some point, JMeter had enabled the summariser output from its version 2.11 in Non-GUI mode. You could see below output when you run your JMeter test.
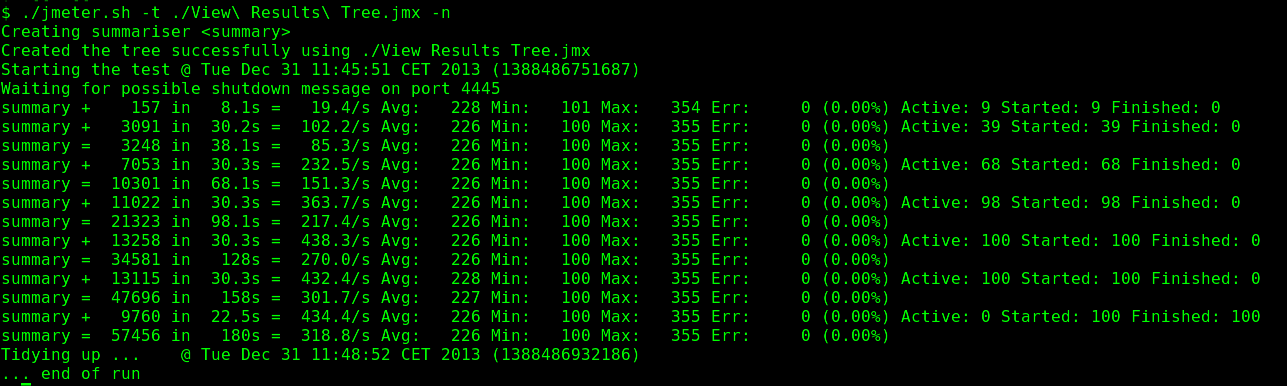
It was little bit helpful & above summary gives decent amount of information you would need while the test is running. It shows the minimum, maximum, average responses times, throughput, error count, no of active users for every 30 seconds (summary interval can be changed in jmeter.properties).
But when the test runs for hours & when you have huge amount of summariser output in the console for every 30 seconds, It might be a bit difficult to understand the results. For ex, If I would like to know the active user count at which the rate drops, I need to go through the summariser output line by line very carefully! I can not share the results with the development team/application architect as the results are not in a very user friendly format. To create a nice graph, I needed to wait for the JMeter test to finish.
So, Instead of writing this summariser output in a console, I modified the JMeter’s summariser class to send the results to a database – So that I could create a nice chart by querying the DB. It was extremely helpful for our team to analyze the performance test results in real time. JMeter also added a separate listener from its version 2.13 which sends the data to a database which could help us in getting real time results.
I would be covering both JMeter’s approach and my approach. You could follow either of these. NOT Both!!
Solution 1:
Backend Listener – JMeter implementation:
JMeter v2.13 has introduced a new listener to send the results to a time-series database (influxdb/graphite) while the test is running. By configuring Grafana (an open source metrics dashboard) to connect to the influxdb/graphite, We can create nice graphs which will help us getting the real time metrics while the JMeter is running the test!!
Time-Series Database: time series is the sequence of data taken over time. Time-series database is a software application which handles the time-series data. Imagine it like a sql-table in which time is the primary key!
We would be using InfluxDB as our database in this post. Check here for more information.
Few Terminologies you might want to know:
- Measurement -> This is equivalent to RDBMS Table
- Series -> Each and every record of Measurement. It is like Rows of the table.
- Tags -> Optional column of the table. It is indexed column for faster search.
- Tag key -> name of the indexed column
- Tag value -> indexed value
- Field -> This is the column which stores the actual data you want to measure. Like response time of a page.
JMeter & InfluxDB Integration:
InfluxDB Setup:
- Download InfluxDB.
- Check this link for InfluxDB setup. [Note: at this time of writing this post, v1.3 is latest influxDB version. If this link does not work, Please check the influxdb site for more information.]
- Locate the config file of influxdb
- either here: /opt/influxdb/shared/config.toml
- or here : /usr/local/etc/influxdb.conf
- If you are unable to locate the config file, You can make influxdb display the default config. Execute below command.
influxd config- The command will display all the default values. Copy the values and create a config file yourself.
- JMeter uses graphite protocol to write the values into InfluxDB. So, locate graphite protocol section in the InfluxDB config file and enable it as shown here.
[[graphite]]
    enabled = true
    bind-address = ":2003"
    database = "jmeter"
    retention-policy = ""
    protocol = "tcp"
    batch-size = 5000
    batch-pending = 10
    batch-timeout = "1s"
    consistency-level = "one"
    separator = "."
udp-read-buffer = 0- Once it is modified, restart the influxdb server with below command to make the changes effective.
influxd -config /path/to/config/file- Check the InfluxDB log for any error. At this point, InfluxDB should be up and running fine.
Once InfluxDB is up and running, then the next step is to create a JMeter test which sends the data to InfluxDB.
JMeter Setup:
- Ensure that you have Java version 8 or above.
- Download JMeter version 3.3 or above
- Launch JMeter. Create a simple test.
- Add Backend Listener.
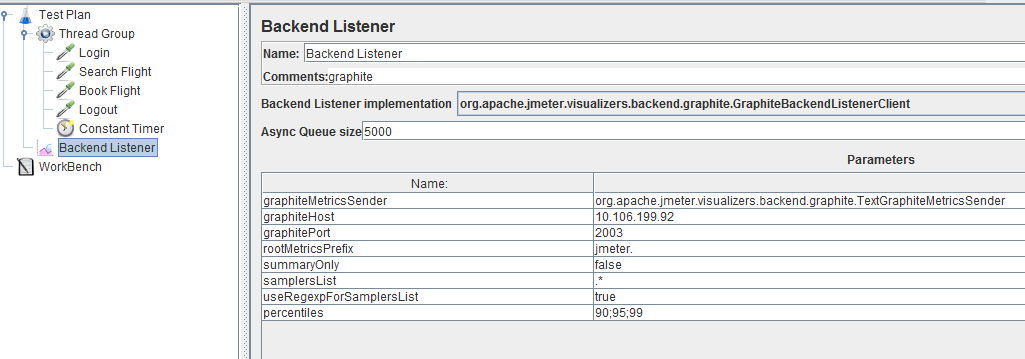

- Update the InfluxDB server IP, port details as shown above
- Run the test. Wait for few seconds
- Check the JMeter log if there is any connection error related to sending data to InfluxDB. You should not see any error! if there is any, Check here for the steps to troubleshoot. Then come back and continue from here!
InfluxDB – Shell commands:
- Execute below commands in the machine where InfluxDB is running.
influx
Connected to http://localhost:8086 version 1.3.6
InfluxDB shell version: 1.3.6- Execute the below command to see the list of databases.
SHOW DATABASES
name: databases
name
----
_internal
jmeter- Execute below command to use JMeter DB.
USE jmeter
Using database jmeter- Execute below command to see the list of tables or measurements under JMeter DB.
show measurements
name: measurements
name
----
jmeter.all.ok.count
jmeter.all.h.count
jmeter.all.ok.min
jmeter.all.ok.max
jmeter.all.ok.avg
...........- At this point, you would see a bunch of measurements created in InfluxDB. JMeter has created those measurements in the ‘jmeter‘ database.
Hope you are able to send the test results to InfluxDB successfully!!! Congrats. Now it is time for us to setup Grafana server to create charts from the test results.
Grafana-InfluxDB Integration:
- Download Grafana
- Start the Grafana server. (In my windows, I have the exe here -> GRAFANA_HOME/bin/grafana-server.exe)
- Launch browser with this URL http://localhost:3000 to access the Grafana home page.
- Update Grafana data source to point to the InfluxDB instance.
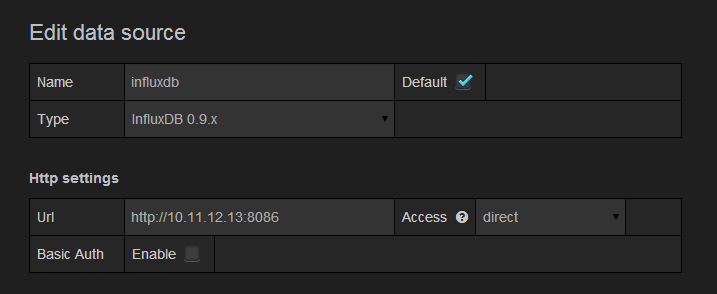
- Click on the Test connection to ensure that Grafana can connect to the InfluxDB.
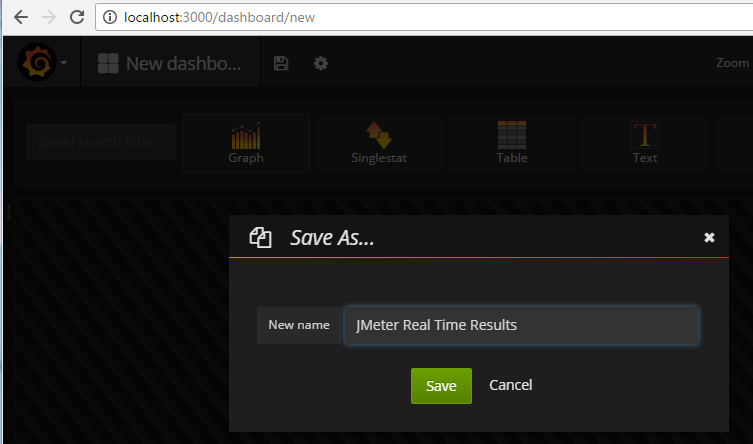
- Create a new dashboard.

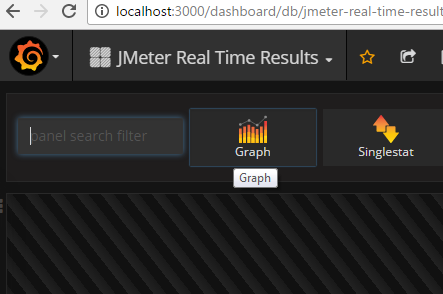
- Lets add a Graph panel

- Once added, Click on the panel title to edit and add query to display the metric you are interested in. Check this video to create a chart on min value metric.

Hopefully you got the idea now!! You can go from here to create different metrics as you want!!
I have created decent looking dashboards for my applications. You can continue reading this article, download and use them!
Problem with JMeter’s Backend Listener:
JMeter’s Backend Listener really helps us in getting the real time performance test results. However, It creates a tons of measurements. The ‘min’, ‘max’ values might match with your aggregate report. But you can not expect the percentiles, throughput, avg to match with your aggregate report!! Because This listener calculates these values for every given interval (like every 1 second). You basically get throughput, avg over time. Not for the whole duration of the test. So, It does not match.
My custom approach helped me to get the results the way I wanted.
Solution 2:
Custom Listener [TestAutomationGuru Implemenation]:
Due to the above mentioned limitation of the JMeter’s Backend Listener & in order to meet my goals, I just wanted to go with my own implementation – by updating the Apache Core library which has the summariser (it is responsible the writing the above mentioned aggregate info in the console) – So whenever it writes the info in the console and it can also update the data in the InfluxDB. Not creating a separate listener for this purpose seems to be ok to me as adding more listeners to the test will consume memory and might affect my test. Performance wise – this approach performs better than the adding new backend listener because I do not have to add any additional logic for the calculation.
InfluxDB Setup:
- Enable HTTP API in the InfluxDB config file for writing the results in InfluxDB. Restart InfluxDB.
[http]
  # Determines whether HTTP endpoint is enabled.
   enabled = true

  # The bind address used by the HTTP service.
   bind-address = ":8086"
InfluxDB – Shell commands:
- Execute below commands in the machine where InfluxDB is running.
influx
Connected to http://localhost:8086 version 1.3.6
InfluxDB shell version: 1.3.6- Execute the below command to create a new DB – jmeter (if it is not there already)
CREATE DATABASE jmeterJMeter Setup:
- You DO NOT need to add any listener to your test!
- Download the modified Apache JMeter’s core library – Replace the existing one in the lib/ext folder. Better to have a backup for the old one before replacing. You should use JMeter version 3.3.
TAG-Influx-Grafana.zip (12377 downloads)
- It will expect below properties. Update user.properties file / pass below properties to the test using commandline / ant etc.
# True to send data to influx db
summariser.influx.out.enabled=true

# True to send write the info it sends to influx db - enable only for debugging purpose
# summariser.influx.out.enabled=false

# Influx host, port, db details details
summariser.influx.url=http://localhost:8086/write?db=jmeter

# use below format if there is any username & password for influxdb
# http://localhost:8086/write?db=jmeter&u=myusername&p=mypassword

# Name of your application - Useful for querying the results when you use this framework for multiple applications
# Do not add any space or dot or any other special chars
summariser.influx.application=myApp

# Perofrmance test strategy - Useful for querying the results when you use this framework for multiple strategies
# Do not add any space or dot or any other special chars
summariser.influx.application.suite=stress-test

# timeouts
summariser.influx.connection.timeout=5000
summariser.influx.socket.timeout=5000
summariser.influx.request.timeout=5000- Run any JMeter test for sometime in the NON-GUI mode enabling summariser. It should send the data to InfluxDB.
InfluxDB – Shell commands:
- Execute the below command to see the list of databases.
SHOW DATABASES
name: databases
name
----
_internal
jmeter- Execute below command to use JMeter DB.
USE jmeter
Using database jmeter- Execute below command to see the list of tables or measurements under JMeter DB.
show measurements
name: measurements
name
----
delta
samples
total
Note:
- If you use testautomationguru’s modified apache_core jar, then you do NOT need ‘Backend Listener‘. The jar itself will take care of sending the results.
- If the apache core library could not reach InfluxDB within the timeout – It will never retry to post the data for the test. This is as per my design! The server could be down or it could be a firewall issue. I do not want to keep trying as it could affect the test performance. Make sure it is reachable.
- This plugin has been designed to post the data only in the Non-GUI mode testing. Running the test in GUI mode is never recommended!
If you are still facing issues in sending the data to InfluxDB - Check this post to troubleshoot.
Grafana Dashboard:
The downloaded zip file should also contain the Grafana dashboards (in JSON format). Import those dashboard files in Grafana (You can find the Import feature under Home as shown below) – Please install Grafana pie chart plugin before importing these dashboards – check here.
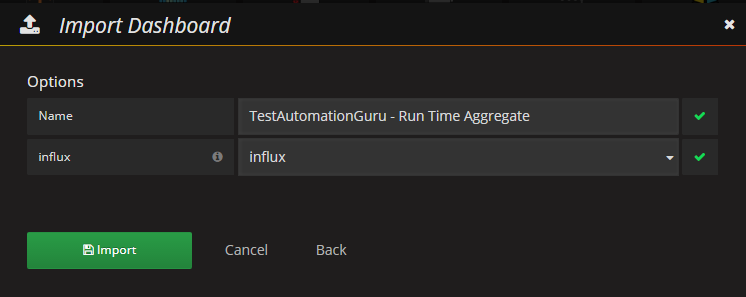

Once it successfully imports, It will create dashboards as shown below. It takes the data from delta and total measurements to show the appropriate metrics. (Make sure that your Grafana has the datasource set correctly. It should point to the InfluxDB instance where we post the data).
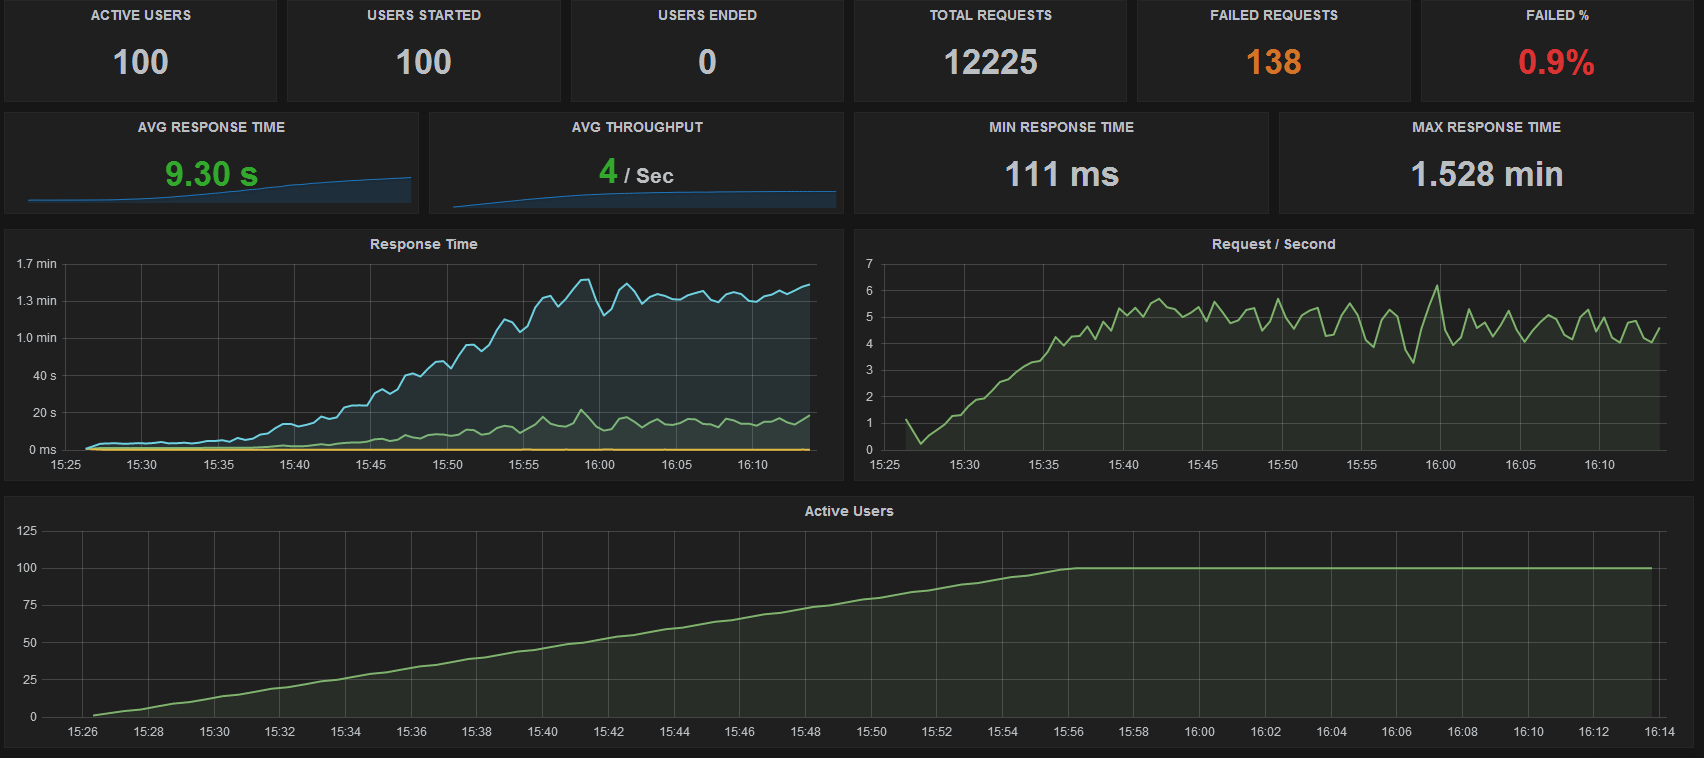
Aggregate Dashboard:

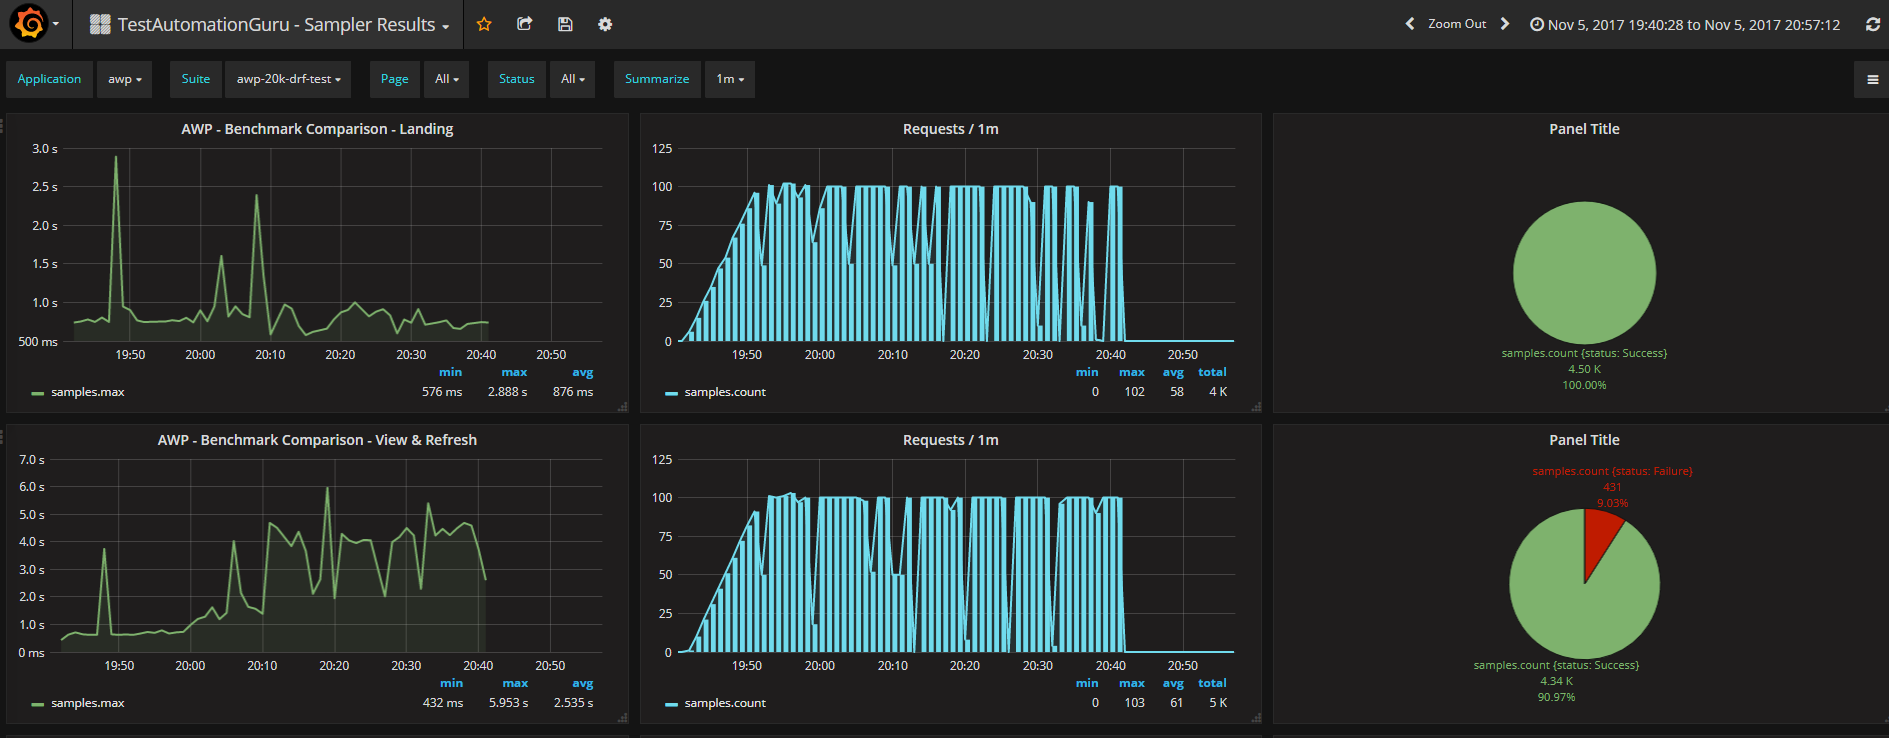
Samples Dashboard:
This dashboard will retrieve the data from Samples measurement. You can filter further based on specific page, their status etc. Sometimes, when the request fails (say some auth error), the response time might be very less – so throughput will be huge. This is not right. This is why I have the status filter to get the success only throughput.
By adjusting the ‘Summarize’ drop down, Let grafana calculate the throughput for different intervals.

Summary:
Using JMeter’s Backend listener / Custom listener + InfluxDB + Grafana – we can create stunning charts which will give us the real time metrics of the test which is being run by JMeter. If you have a long running tests, You do not need to wait for the test to finish to access the results. Just share the Grafana dashboard URL – so that anyone with link can see what is going on!
Please check below articles as well which are related to this.
Having Issues?
Note: Make sure that the system time of the Influx server is in sync with the machine which runs JMeter. This is very important. Because when you query Influxdb – by default it shows the records which has the time as <= system time. If the JMeter machine’s time is, say 4:50 PM. InfluxDB server system time is 4:45PM. When you run JMeter test, It will be able to post the records to InfluxDB. However when you query influxdb, It will not show these records. You need to wait for 5 mins to see the records inserted.
Even after following all the steps, It does not work as expected? No problem; Check here for the steps to troubleshoot.
Happy Testing & Subscribe 🙂