

Little’s law should probably be the one of the most famous queuing theories! Lets see how it can be used in performance testing.
Little’s Law:
The long-term average number of customers in a stable system N is equal to the long-term average effective arrival rate, λ, multiplied by the average time a customer spends in the system, W; or expressed algebraically: N = λW.
Little’s law is universal. It can be applied anywhere where a queue is present. From a retail store to a CPU / application server.
Lets assume a ticket counter in which the user spends 15 minutes (W) on an average. Customers are arriving at the rate of 20 customers per hour(λ). Lets assume everyone buys the ticket.


Using Little’s law, we can calculate the average number of customers in the system at any time would be N = λW
λ = 20/ hour
W = 15 minutes= 0.25 hours
So, N would be 5 = (0.25 * 20)
Even-though we can expect 20 customer’s an hour, as the customers are spending only 15 minutes in the counter, there will be only 5 customers in system. 4 in queue and 1 is being serviced.
Arrival Rate:
The rate at which the customers are entering the system is known as arrival rate.
Exit Rate:
The rate at which the customers are leaving the system is known as exit rate.
Little’s Law assumes a stable system so the arrival rate and departure rate are identical.
Little’s Law in Performance Testing:
Little’s law can also be applied for our web / app / db servers to relate the total no of users/requests, server’s throughput & the average response time.
Throughput is number of requests processed per unit time; It can be used as the exit rate (λ).
Response time – average response time is amount of time a request spent in the System (W). It includes wait time + service time.
N = Throughput * Response Time

Think time affects the system throughput. so, if there is any think time, then
N = Throughput * (Response Time + Think Time)
Performance Test Results Validation:
Lets see few examples to understand how little’s law can be used to validate our performance test execution results.
- In my tomcat server, I update the max number of thread counts in the pool in the server.xml as shown below. It means, my tomcat server can process only 10 requests in parallel. If I get more than 10, It will be queued. Lets see how little’s law can be applied here.
- I also want to control the response time. I update the tomcat example hello.jsp file as shown here. I add an explicit 2000 milliseconds – so that tomcat takes 2 seconds to process this request and respond.
Now we know that each request to access this page would be taking 2 seconds to process. We also know that we have only 10 threads in the pool.
So tomcat can process 10 requests in 2 seconds. I restrict my tomcat’s server throughput to be (10 / 2 =) 5 requests / second.
- I create a simple test with 10 concurrent users to access the page. I ran the test for sometime.
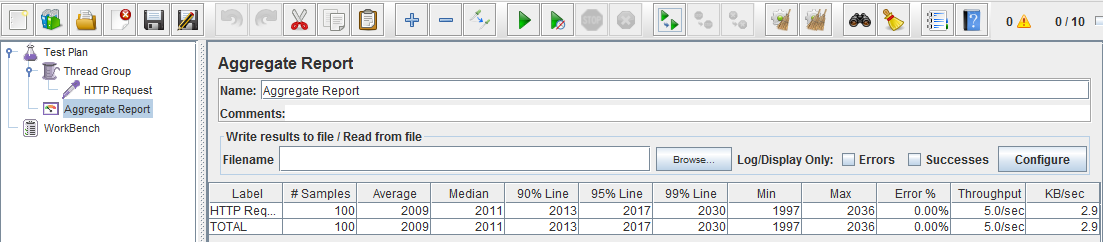

As per the above JMeter’s aggregate results,
Average response time (W) is 2009 milliseconds.
Throughput (λ) is 5 / sec.
So, Number of users in the system N
N = Throughput * Response Time
N = 5 * 2.009
N = 10.045 which is very close to 10.
- I reran the same test with 50 concurrent users this time. I get below result.
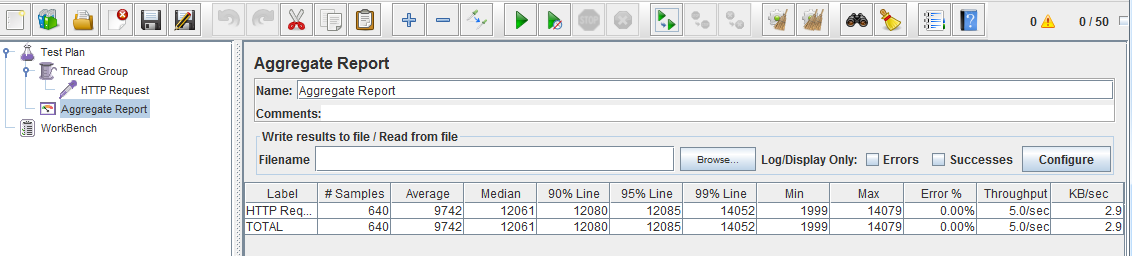

W = 9.742 seconds
λ = 5 / second
N = 9.742 * 5
= 48.71 which is close to 50.
This confirms that the response time was in sync with user load. Little’s law can be used to verify if your performance test results are accurate as shown above.
Workload Modeling:
Workload modal is simply a set of business transactions performed by given concurrent users for a given time to analyze the behavior of the system under test.
Workload modal is very important in Performance testing. If it does not reflect the end user’s pattern, then your performance test results are simply waste!
We can not create a simple performance test plan with random no of users with an arbitrary think time!
In order to come up with a proper workload modal, you would need atleast the following information.
- Critical business transactions
- No of VUsers
- % of users for an action
- Think time
- Desired Throughput
Usually it should be given by the customer / business analysts etc. Sometimes, as a Performance test engineer, you might face an issue that Client would not have any idea about the non-functional requirements. However, they want the performance testing to be done. Lets see how we can use little’s law with the help of google-analytics tool to come up a workload modal.
Google analytics tool can give us the frequently visited pages. This is a good information to come up with business workflows involving those pages and % of users for an action.
Throughput Calculation:
For one of the applications, google-analytics was showing below information on a peak day of the year.
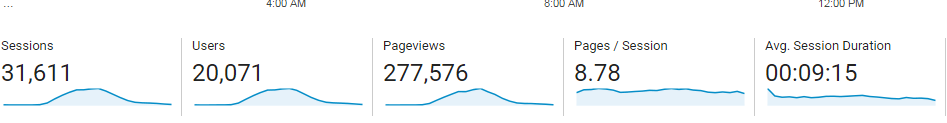

- 20,071 users logged in
- 277,576 page views
From the page views, We can calculate the server’s throughput.
That is, if the server processed 277,576 pages per day, then it would have processed 3.2 page request per second. (277576 / (24 * 60 * 60))
But that is not right!
Google-analytics also give the page views distribution over time on that day. during peak hours, our server processed 34,435 pages in an hour.
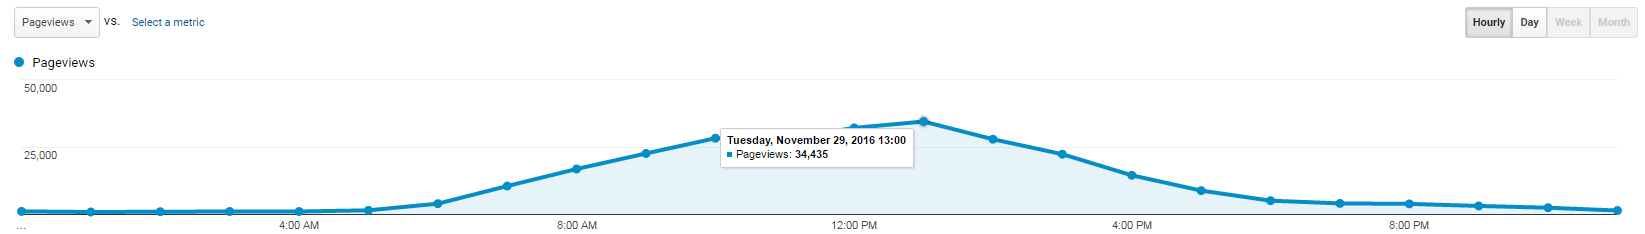

So, we can use this peak hour value for our desired throughput calculation. 34435 / (60*60) gives 9.56 pages / second which should be desired throughput.
Think Time Calculation:

From the above image, an user session lasts for 9 minutes and 15 seconds which is 555 seconds.
During a session, the user views 8.78 pages.
The time between 2 page views would be = 555 / 8.78 = 63 seconds
Response Time + Think Time = 63 seconds
If we know the response time, we can adjust the think time accordingly.
Total users Calculation:
Google analytics also show that during peak hours we had around 3904 users.
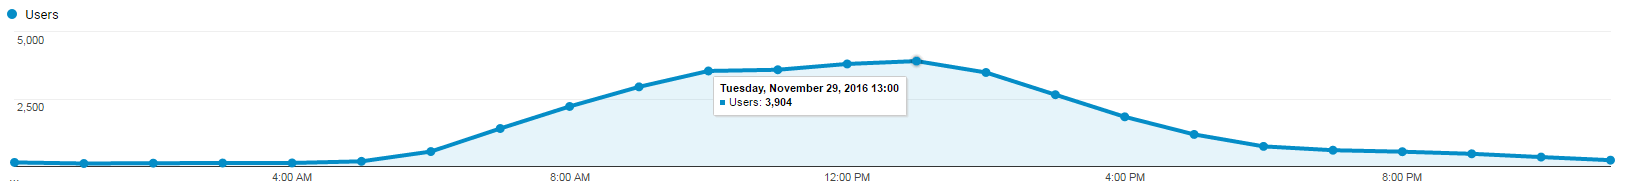

It does NOT really mean you need to run your load test with 3904 concurrent users. Because it is an aggregated information for an hour.
As per Little’s law, total number of users N = Throughput * (Response Time + Think Time)
N = 9.56 * 63
N = 602 users
602 concurrent users are enough to run the load test.
That is, by designing a test plan with lasts for 9 minutes and 15 seconds for an user and with 602 users, you will have 3910 user logins which is very close to our current production workload.
Summary:
Some of the Performance testers I know, might know, how to come up with a test plan using JMeter / LoadRunner / other tools. But they assume that whatever the results, they get, are accurate. It does not have to be! For ex: You might have very limited resources in your system – if you run a JMeter test with 1000 concurrent users, JMeter will give some results. Never assume that the results are correct. Always cross check your results using little’s law. As per the JMeter’s results, Lets say throughput 50 / second and Avg . response time (including think time) is 13 seconds.
N = 50*13
N = 650
Our expected N should be around 1000. So something is wrong here!!
Thus Little’s law can be used to ensure that the observed performance results are not due to bottlenecks imposed by the our load generating tools.
Happy Testing & Subscribe 🙂