

Overview:
Load testing, implemented properly and performed throughout the development cycle, can significantly reduce the number of failures experienced by an application. Performance related issues in production affect the revenue the application generates and it is also very expensive to fix! Performance testing is not just done to measure overall the response time of the application and but also to understand the behavior of the system with other applications in the system!
There are many types / strategy of load testing, each of which simulate different load on the application. Each strategy helps us to identify different types of problems in the application / infrastructure.
For ex:
- Stress test – is performed to analyze the characteristics of the application under extreme load. It also examines if the system is able to recover if load is reduced back to normal.
- Soak test – is performed to maintain a steady state with specific number of users continuously for few days – to uncover any memory / connection leaks!
Aim of this article is to explain how to run different performance tests to identify potential issues by using property files.
JMeter Test Plan:
In order to execute multiple strategy using a single JMeter test plan, We need to follow certain best practices while designing JMeter test scripts. I would suggest you to read these articles in the given order first before continuing this article.
- JMeter – How To Create Reusable & Modular Test Scripts
- JMeter – How To Run Multiple Thread Groups in Multiple Test Environments
If you had read the above articles, then this article is basically going to be very simple for you!
Sample Test Plan:
Lets consider the below test plan for better understanding!
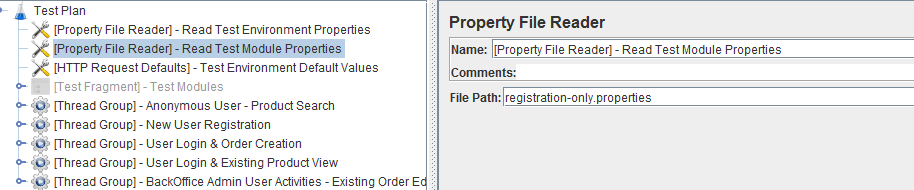

The above test plan has multiple thread groups. It uses a Property File Reader to read the environment configuration details and another instance of Property File Reader to read the thread group configuration. Now, We are going to modify this test plan slightly to execute different test strategy easily.
Thread Groups – Default Properties:
- First I create a default property file with the default values as per my requirement. For me, default load should be 0 users for all the thread group and timer value should be any default value as shown here.
# default.properties

# default think time in milliseconds
timer.wait=10000

# Anonymous User - Product Search
group1.usercount=0
group1.rampup=0
group1.duration=0

# New User Registration
group2.usercount=0
group2.rampup=0
group2.duration=0

# User Login & Order Creation
group3.usercount=0
group3.rampup=0
group3.duration=0

# User Login & Existing Product View
group4.usercount=0
group4.rampup=0
group4.duration=0

# BackOffice Admin User Activities - Existing Order Edit/Cancel
group5.usercount=0
group5.rampup=0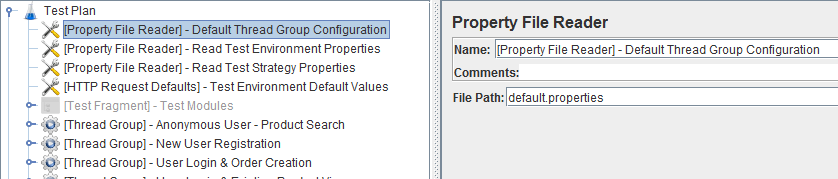
group5.duration=0- Add a Property File Reader to read the default.properties first. We always read the default configuration first.

- Then I create different property files for each strategy to override the default values.
- For ex: I have a system-warmup.properties as shown here. This is basically to warm up the system for 5 mins with single user load per thread group.
# system-warmup.properties

# default think time in milliseconds
timer.wait=0

# Anonymous User - Product Search
group1.usercount=1
group1.rampup=1
group1.duration=300

# New User Registration
group2.usercount=1
group2.rampup=1
group2.duration=300

# User Login & Order Creation
group3.usercount=1
group3.rampup=1
group3.duration=300

# User Login & Existing Product View
group4.usercount=1
group4.rampup=1
group4.duration=300

# BackOffice Admin User Activities - Existing Order Edit/Cancel
group5.usercount=1
group5.rampup=1
group5.duration=300- I create a soak-test-strategy.properties.
# soak-test-strategy.properties

# Anonymous User - Product Search
group1.usercount=300
group1.rampup=300
group1.duration=28800

# New User Registration
group2.usercount=100
group2.rampup=100
group2.duration=300

# User Login & Order Creation
group3.usercount=100
group3.rampup=100
group3.duration=300

# User Login & Existing Product View
group4.usercount=200
group4.rampup=200
group4.duration=28800

# BackOffice Admin User Activities - Existing Order Edit/Cancel
group5.usercount=20
group5.rampup=20
group5.duration=28800- I create a new-user-registration-stress.proeprties. Note that we ignore other thread group details here as the default values are 0. We override only the specific properties.
# new-user-registration-stress.properties

# New User Registration
group2.usercount=400
group2.rampup=100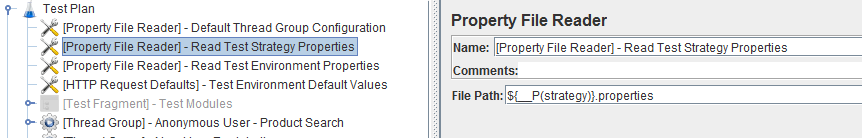
group2.duration=1800- The Second Property File Reader in the Test Plan should be modified to read the specific strategy file we are interested to execute.

Jenkins Jobs:
- We already have created a JMeter Test Plan as explained above.
- We also have created different property files for each performance test strategy.
- Now It is time for us to create multiple Jenkins job for each strategy. [You could parameterize the strategy as Jenkins Environment value. But it is not recommended here]
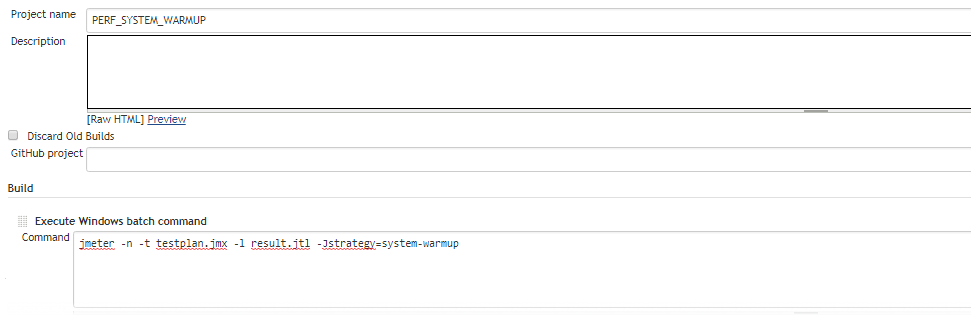

- For ex: I create a Jenkins job for system warm up. Pass the strategy you want to run as a parameter to the test as shown above. If you are new to JMeter-Jenkins integration, then please read below articles.
- JMeter – Continuous Performance Testing – JMeter + ANT + Jenkins Integration – Part 1
- JMeter – Continuous Performance Testing – JMeter + ANT + Jenkins Integration – Part 2
- Once you have created, you create a performance jobs pipeline as shown below.
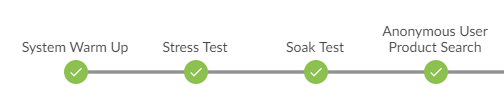

- I would suggest you to read this article on Jenkins Performance Pipeline.
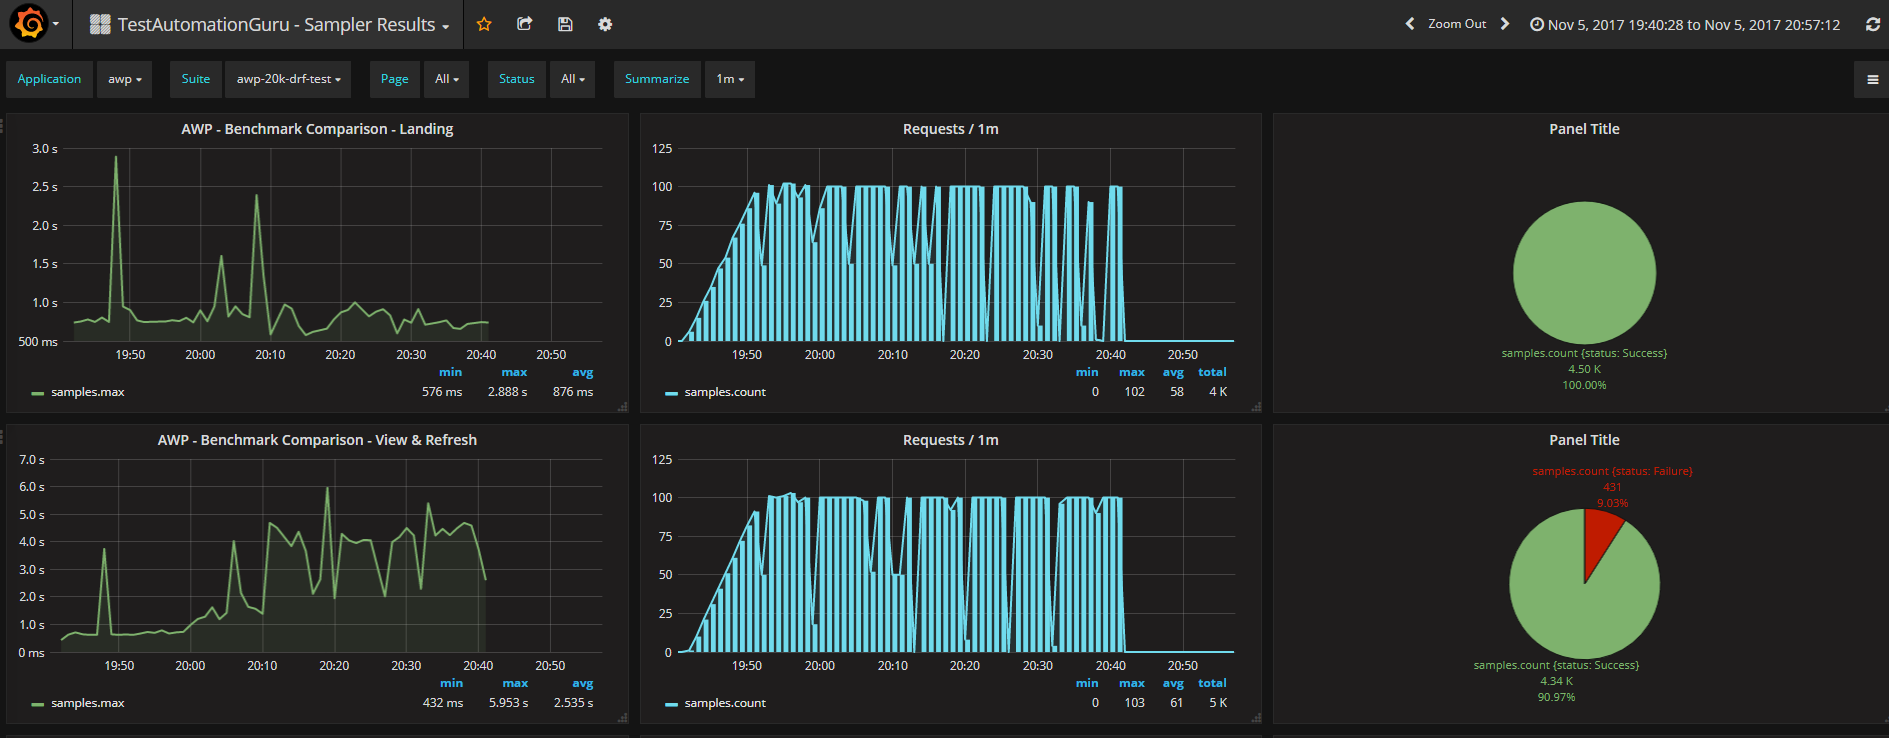
Real Time Results:
- I had already covered the real time results using JMeter + InfluxDB + Grafana with TestAutomationGuru’s modified apache_core.jar.
- By selecting different values in the ‘Suite’ dropdown below, you could view different test strategy results. Check here for the below setup.

Summary:
By properly designing a Performance test plan in JMeter with ‘Property File Reader’ element, we execute a specific test strategy at run time. Each strategy reveals different kind of performance issues. By creating Jenkins pipeline, we also execute different strategy on a daily basis as part of daily build to find the performance issues as early as possible in the SDLC.
Happy Testing & Subscribe 🙂