

Overview:
Testautomationguru already has released few detailed articles on creating real time results during Performance Testing. If you have not read them before, I would suggest you to check them out first.
- JMeter Real Time Results – Basic Setup
- JMeter Real Time Results – Advanced Setup for multiple projects
- JMeter – Server Performance Monitoring
- JMeter – JMX Monitoring

Challenge:
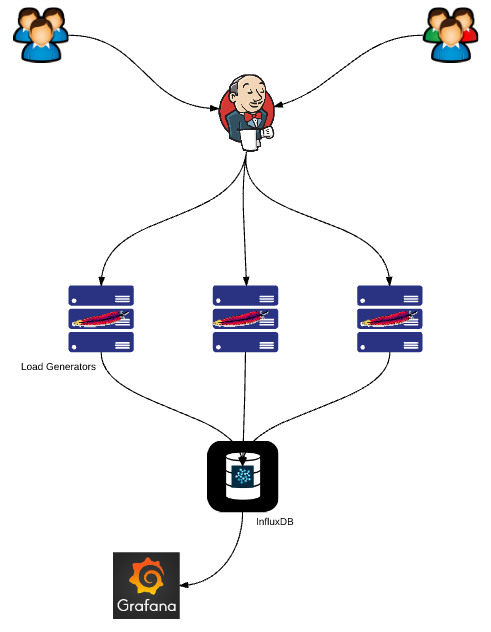
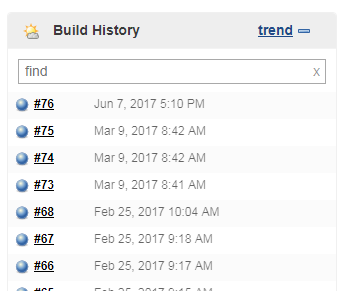
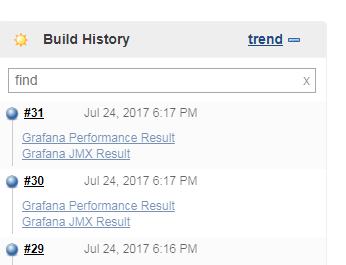
The challenge here is, We have multiple systems in our architecture. Jenkins, JMeter-Load-Generators, InfluxDB, Grafana etc. When we run our performance test through Jenkins, we have our build history as shown here. It is little bit difficult for us to access the corresponding Grafana dashboard for the old Jenkins runs from the build history – We need to adjust the time in the Grafana based on the Jenkins build time to get the results.

In this short article, We are going to see how to provide a dynamic link to Grafana dashboard in Jenkins as part of the build. So that It is easy to access the performance test results from the build history.
Getting Grafana Dashboard URL:
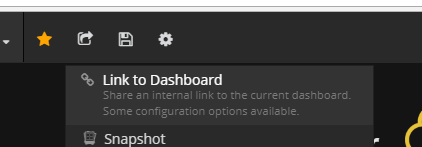
- First, Go to Grafana. click on share Dashboard button.

- Click on Link to Dashboard to get the link – so that we could dynamically build URL modifying time stamp in it.
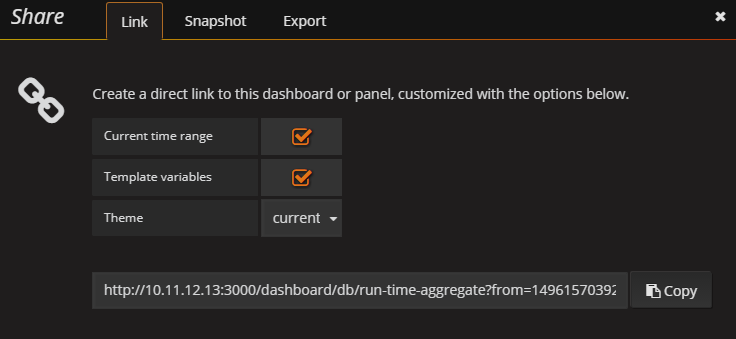

- I have below URL for my dashboard. Here we just need to replace from and to time. Everything else remains unchanged. If you have template variables, Your URL might have some additional attributes along with time. That is fine. You do not need to change them. We will just replace time in it.
http://10.11.12.13:3000/dashboard/db/run-time-aggregate?from=1496157039283&to=1500936673672
Jenkins – Grafana Integration:
- Install Groovy Post Build plugin.
- For the Performance Test Jenkins job, we would add ‘Groovy Post Build’ action.
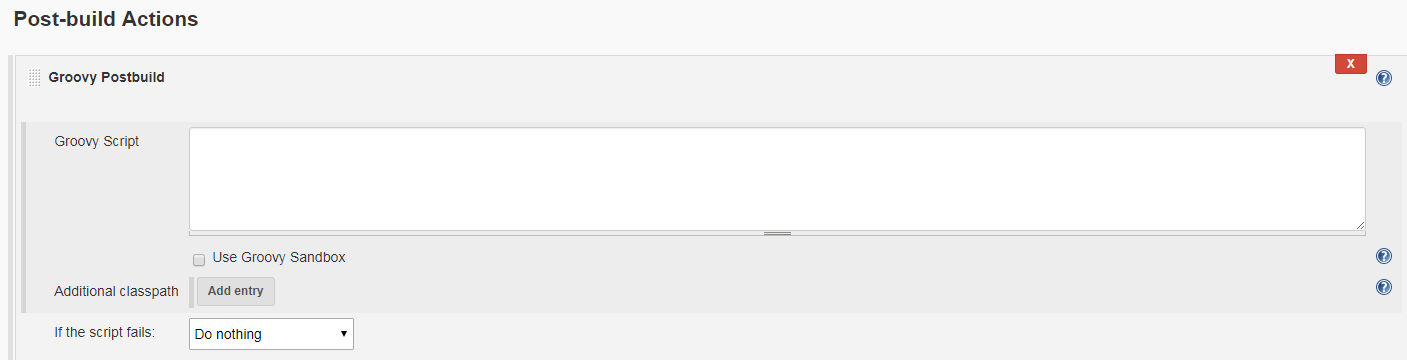

- In this section, We would add below script which builds the URLs for the Grafana dashboards dynamically.
import hudson.model.*

//get current build
def build = Thread.currentThread().executable

// grafana url for aggregate dashboard - replace time stamp with %s
def perfResult = "http://10.11.12.13:3000/dashboard/db/run-time-aggregate?from=%s&to=%s"
def jmxMonitor = "http://10.11.12.13:3000/dashboard/db/jmx-monitor?from=%s&to=%s"

// get build start and end time
def start = build.getStartTimeInMillis();
def end = start + build.getExecutor().getElapsedTime();

// replace time
perfResult = String.format(perfResult, start, end);
jmxMonitor = String.format(jmxMonitor, start, end);

//build the string to be added as description.
def link = "<a href='%s'>%s</a><br/>";
def sb = new StringBuilder();
sb.append(String.format(link, perfResult, "Grafana Performance Result"))
  .append(String.format(link, jmxMonitor, "Grafana JMX Result"));

// set build description
build.setDescription(sb.toString());- Thats it!! Now, whenever the Jenkins runs the performance test, once it is run, It adds the URLs for the Grafana Dashboards in the build description as shown below.

Summary:
Each Jenkins build has the corresponding URLs for Grafana Performance Test Results and JMX Results. We could even add the Kibana URL for the performance result log if you are collecting HTTP response as described in this article.
Happy Testing & Subscribe 🙂