
Overview:
In this tutorial, I would like to show you how we could enable Distributed Tracing In Microservices by using Jaeger with Spring Boot.
Distributed Tracing In Microservices:
There is a quote that ‘Troubles do not come alone and they would like to arrive in group‘. So are Microservices! They do not come alone! We will have often 10+ microservices for a small /mid size application. For large applications it could even be hundreds.
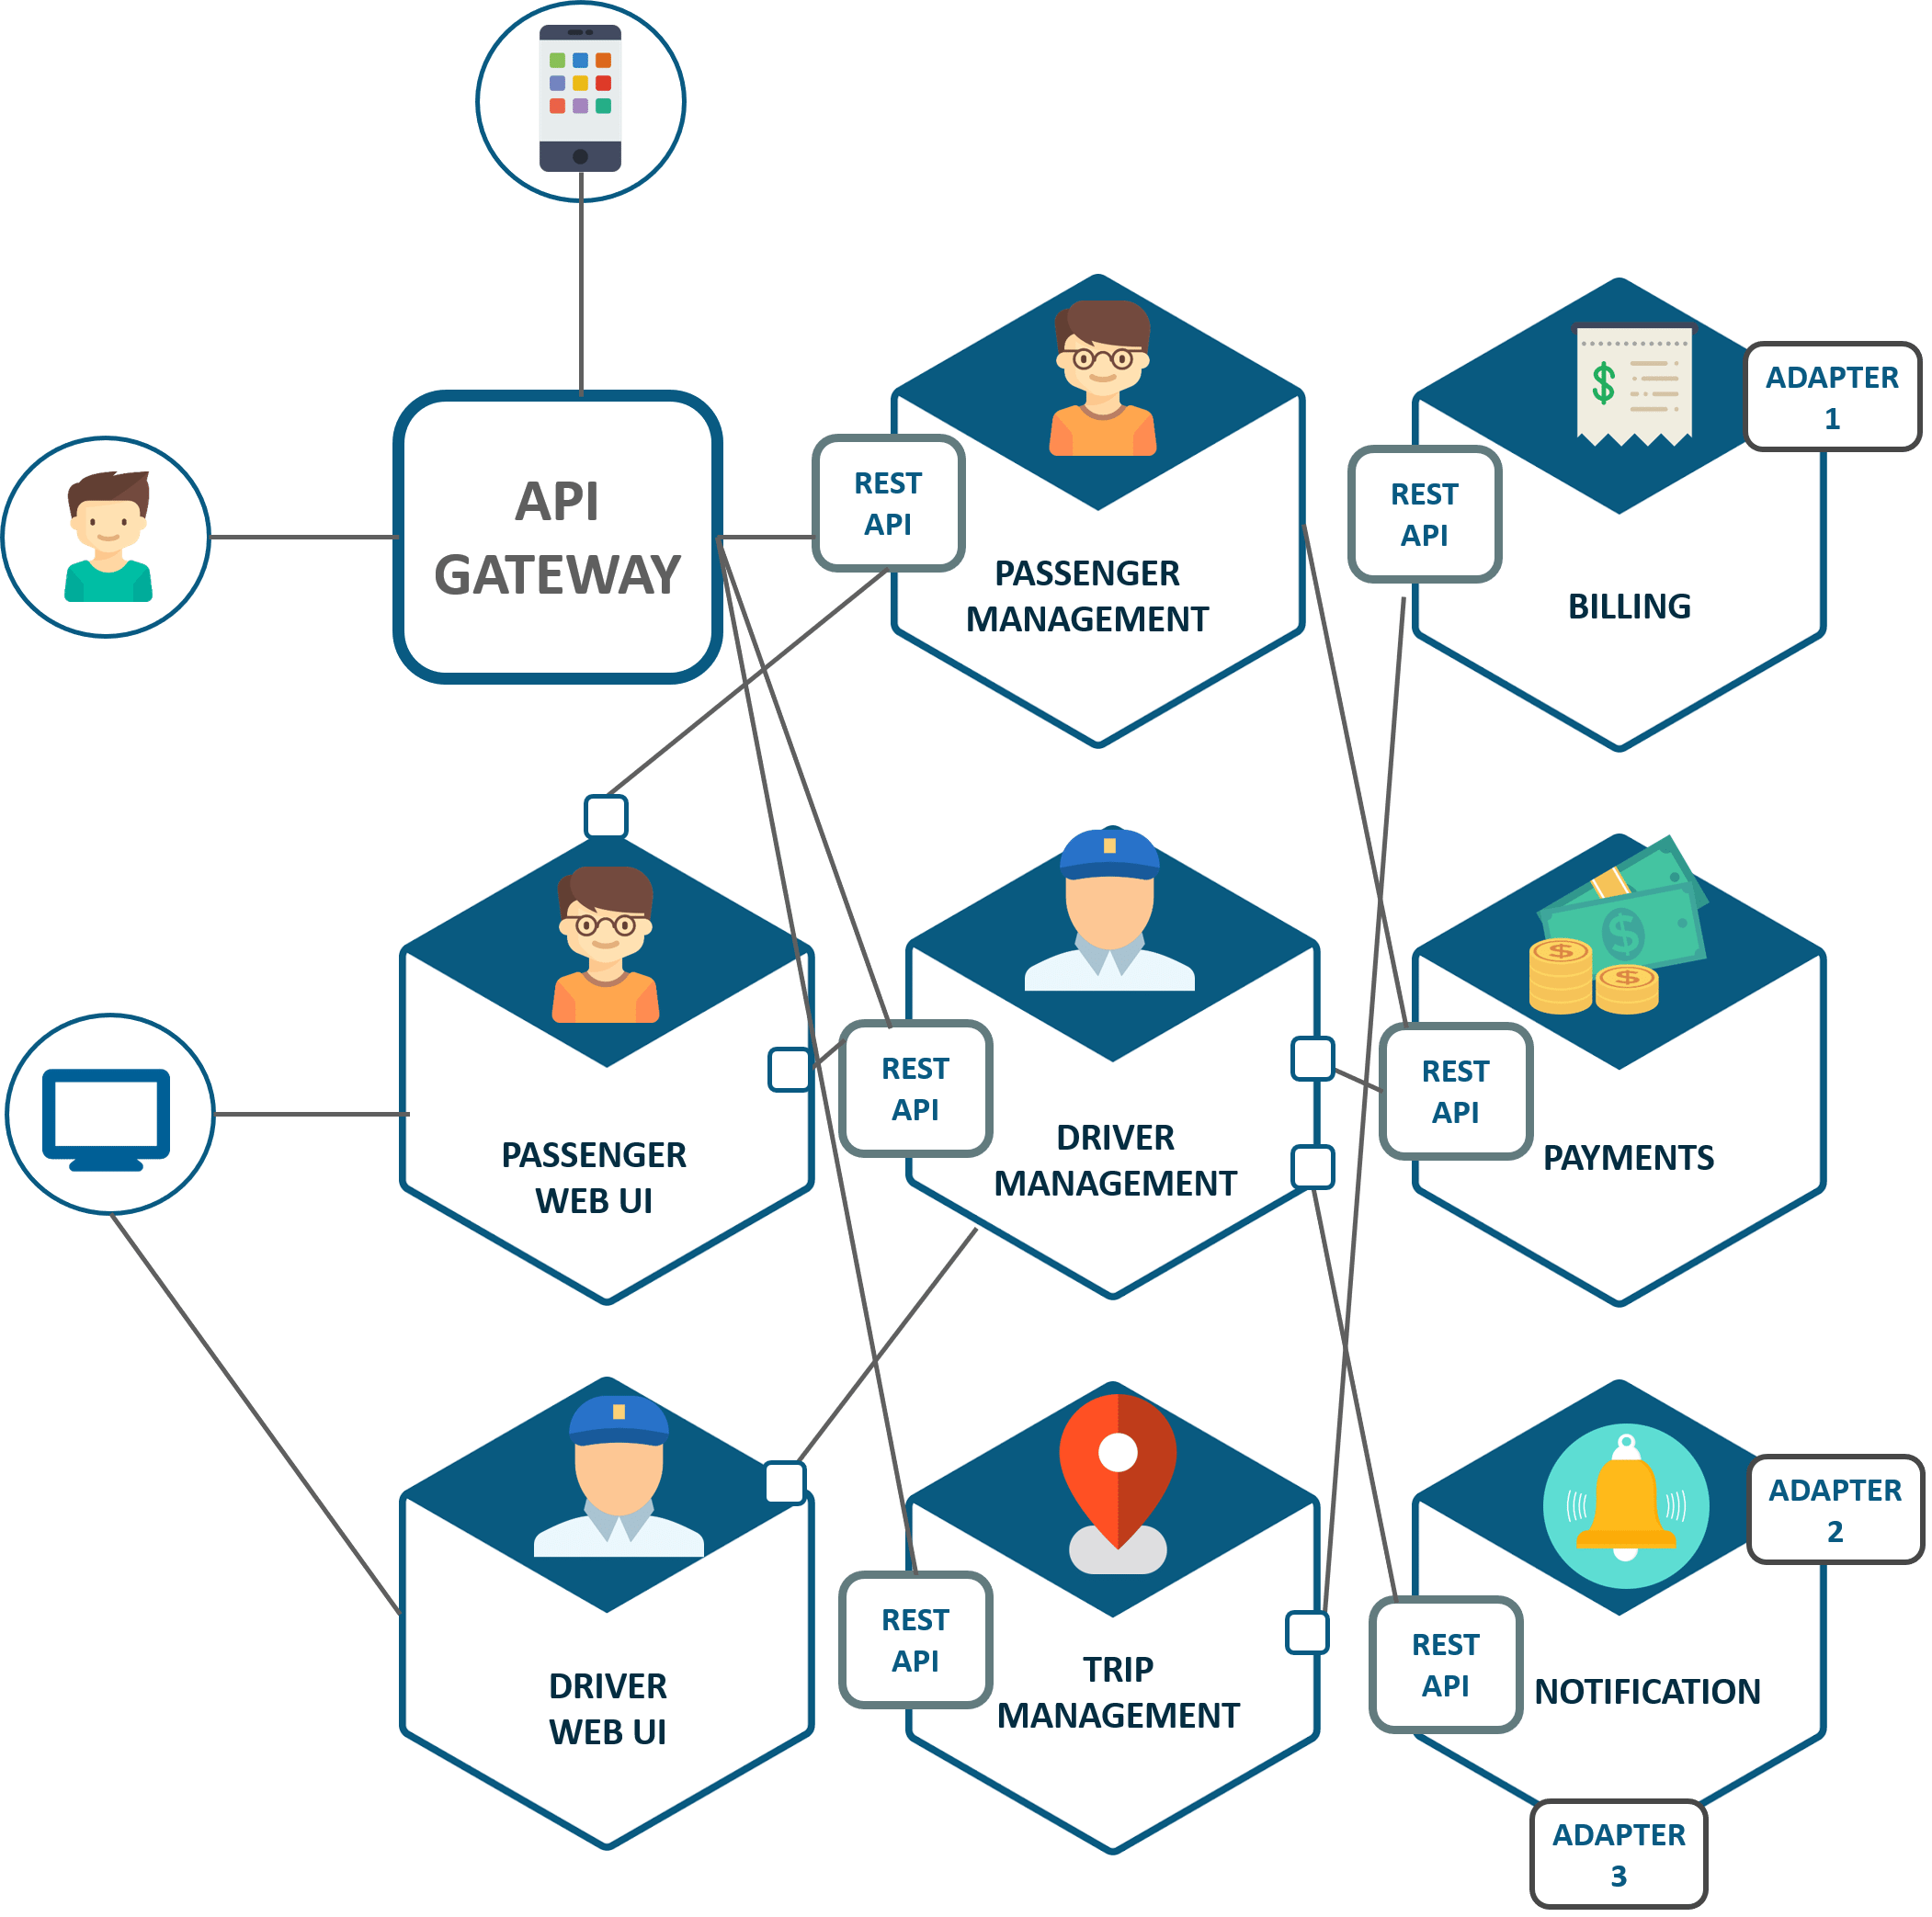
Most of the times, one microservice might depend on another microservice to process a request. In that case when the client/browser sends a request to one of the microservices, then the request could be processed by multiple microservices internally before the client/browser gets the response. If everything goes fine, It is great. But what If one of the microservices fails / throws an exception during some processing.
This unhandled exception would be propagated to other microservices & finally to the client. Depending on the design, a microservice might receive requests from N number of microservices. In that case, we might need to trace the complete request from the client to the last microservice in the request processing chain. So that we could understand what really happened and which service failed when a particular request was sent.
If the user experiences application slowness, how can we locate the specific service which is causing the performance issue when there are N number of services!
Tracing transactions in distributed systems is not easy! Anything could go wrong with Network!
So, Distributed Tracing is a way of understanding the complete chain of events in Microservices based architecture.
Sample Application Without Distributed Tracing:
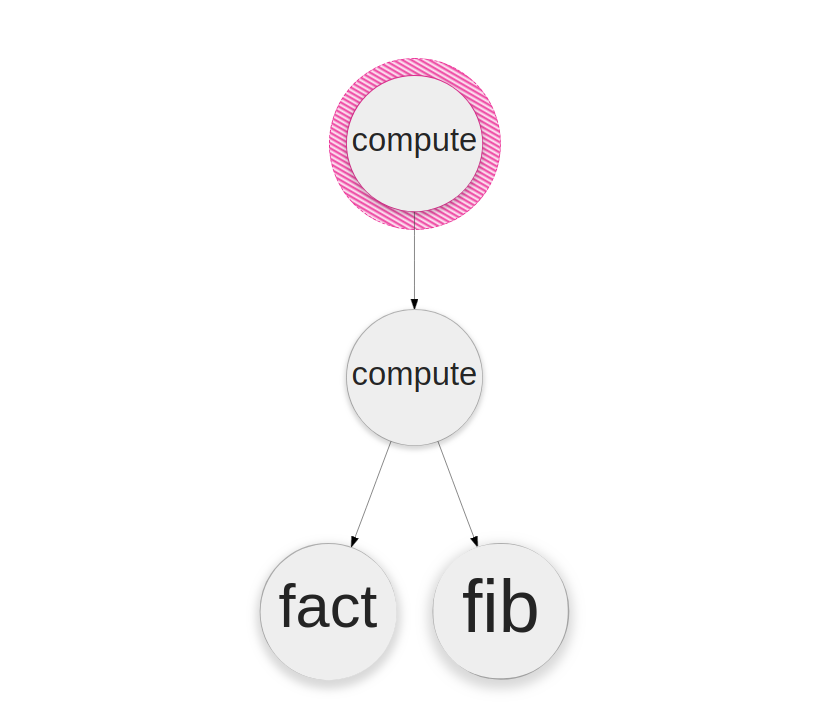
Lets consider a simple application with 3 microservices as shown below.
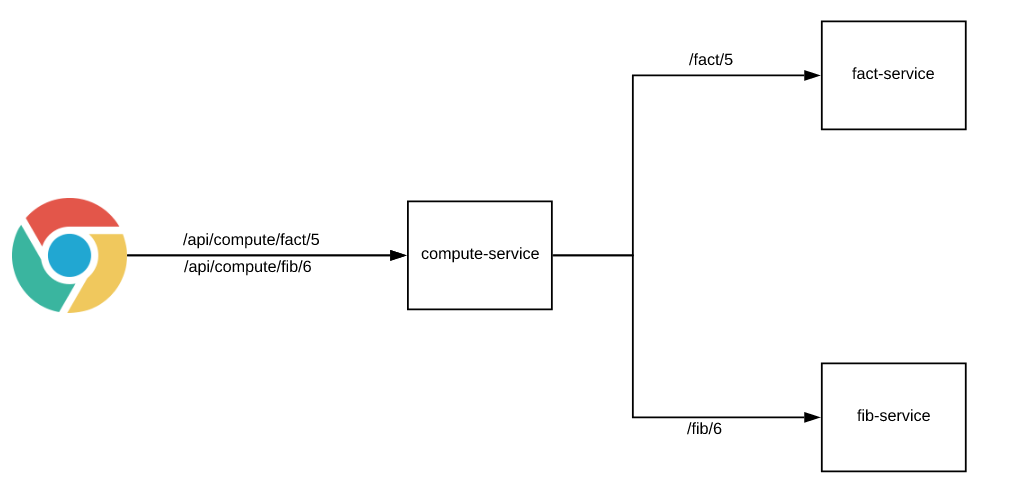
- fact-service: responsible for calculating the factorial for a given number.
- fib-service: responsible for calculating the Fibonacci value for the given position.
- compute-service: simply a Backend-For-Frontend service. It does not know how to calculate these values. It simply delegates to the appropriate services, gets the job done and responds back to the client.
Client sends a request to calculate either factorial or fibonacci value for a number. To make things simple, Lets assume that all are GET requests. (The source code is shared at the end of this article). Lets run this application and test. (Without distributed tracing).
- I run this application with docker-compose
version: "3"
services:
  fact-service:
    image: vinsdocker/fact-service
    environment:
      - ACTIVE_PROFILE=prod
      - SPRING_APPLICATION_NAME=fact
  fib-service:
    image: vinsdocker/fib-service
    environment:
      - ACTIVE_PROFILE=prod
      - SPRING_APPLICATION_NAME=fib
  compute-service:
    image: vinsdocker/compute-service
    environment:
      - ACTIVE_PROFILE=prod
      - SPRING_APPLICATION_NAME=compute
    ports: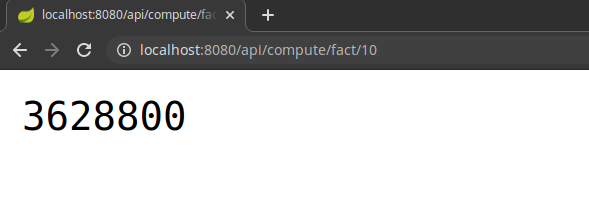
- 8080:8080- I send the below request to calculate the factorial which is working fine.
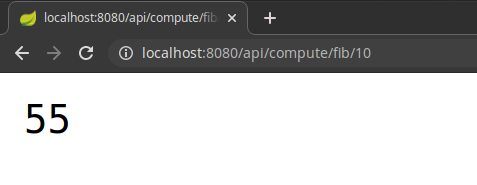
- I send the below request to find the Fibonacci value for the given position which is also working fine.
- In the above request 10 is fine. I need to know the value for the position 50. But I get the below error response for 50!
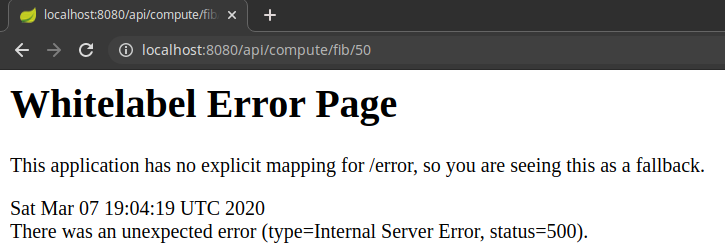
- For the browser, it always sends the request to the compute-service and it failed. But as we have N number of microservices, we need to trace the request and see what exactly caused this failure.
Debugging such failures is very difficult when you have multiple microservices involved in processing a request. We would not know which service failed and where to check the log immediately.
Jaeger:
Now we have understood the need for Distributed Tracing in Microservices. but we need some tools to achieve that. Jaeger is a distributed tracing platform – originally developed by Uber. It is used for monitoring and troubleshooting issues with Microservices based architecture. It has a nice UI which clearly shows the complete request details & processing times etc.
Jaeger With Spring Boot:
After seeing issues with our application as shown above, Lets enable Distributed Tracing In Microservices. Using Jaeger With Spring Boot application is very easy! As usual Spring Boot does all the heavy lifting.
-
Maven Dependency:
<dependency>
    <groupId>io.opentracing.contrib</groupId>
    <artifactId>opentracing-spring-jaeger-web-starter</artifactId>
    <version>1.0.3</version>
</dependency>-
Application Properties:
server:
  port: 8080
opentracing:
  jaeger:
    udp-sender:
      host: localhost
      port: 6831
With the above dependency, Jaeger-agent gets auto configured via Spring Boot and starts tracing all the requests & processing times etc. Rebuild the application and docker images after updating with Jaeger dependency.
-
Jaeger UI:
Once Jaeger agent starts collecting the metrics, It has to post the details somewhere – so that we can start checking on the UI. So download and install the Jaeger in your machine. By default It uses the UDP port 6831 for collecting the details. It also supports other protocols. Check the Jaeger site for more details. Lets go with UDP as it is a layer 4 protocol and it is very fast compared to HTTP.
Setting Jaeger up and running using docker is very easy! The below docker-compose file provides the complete set up including the 3 microservices.
version: "3"
services:
  fact-service:
    image: vinsdocker/fact-service
    environment:
      - ACTIVE_PROFILE=prod
      - SPRING_APPLICATION_NAME=fact
  fib-service:
    image: vinsdocker/fib-service
    environment:
      - ACTIVE_PROFILE=prod
      - SPRING_APPLICATION_NAME=fib
  compute-service:
    image: vinsdocker/compute-service
    environment:
      - ACTIVE_PROFILE=prod
      - SPRING_APPLICATION_NAME=compute
    ports:
      - 8080:8080
  jaeger:
    image: jaegertracing/all-in-one:1.17
    ports:
      - 8090:16686
Sample Application With Distributed Tracing:
Our entire infrastructure is up and running using docker-compose. I send the below requests.
http://localhost:8080/api/compute/fact/10

http://localhost:8080/api/compute/fib/10

http://localhost:8080/api/compute/fib/50
The last request will fail as usual. Now lets check the Jaeger UI for more details. The UI shows all the microservices.
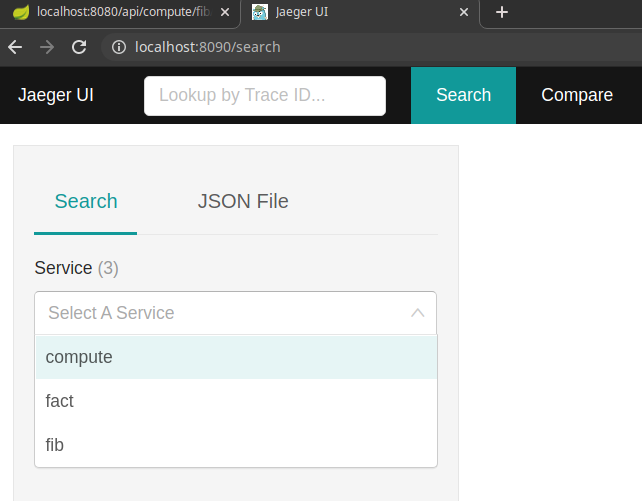
I select compute and click ‘Find Traces’. It shows all the 3 requests I had sent.
- X axis shows the timestamp
- Y axis shows the duration of the request
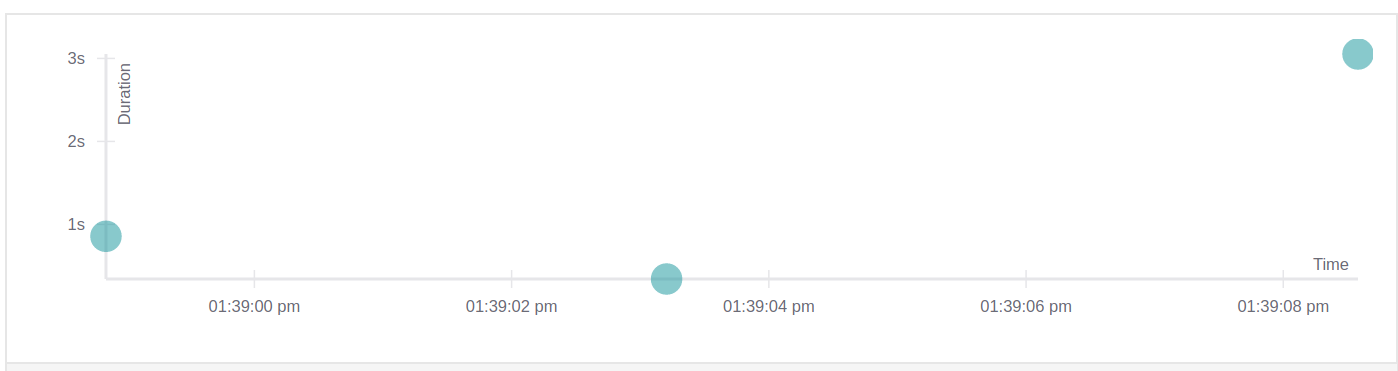
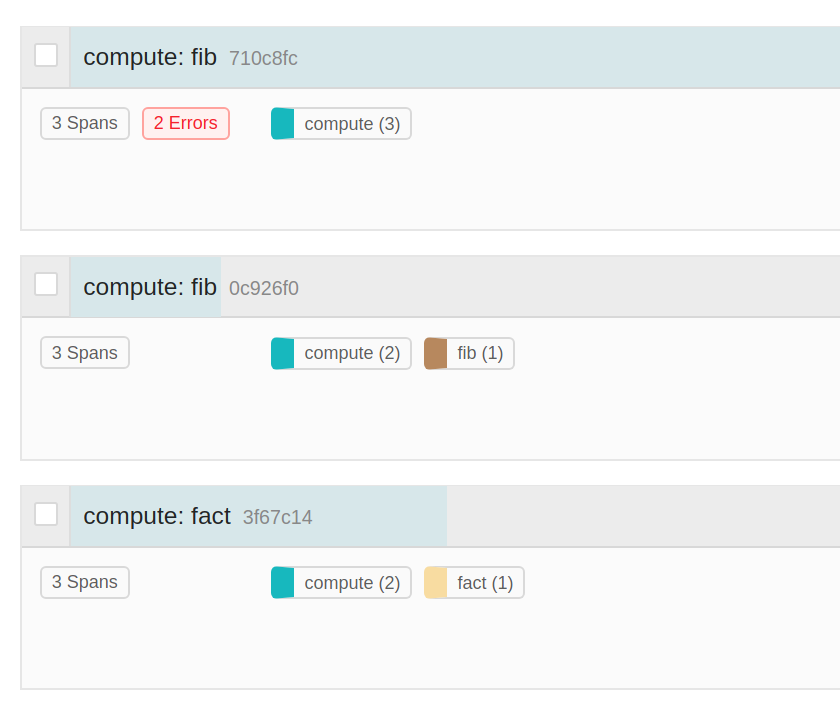
It shows the 3 requests and the corresponding microservices involved in processing the requests.
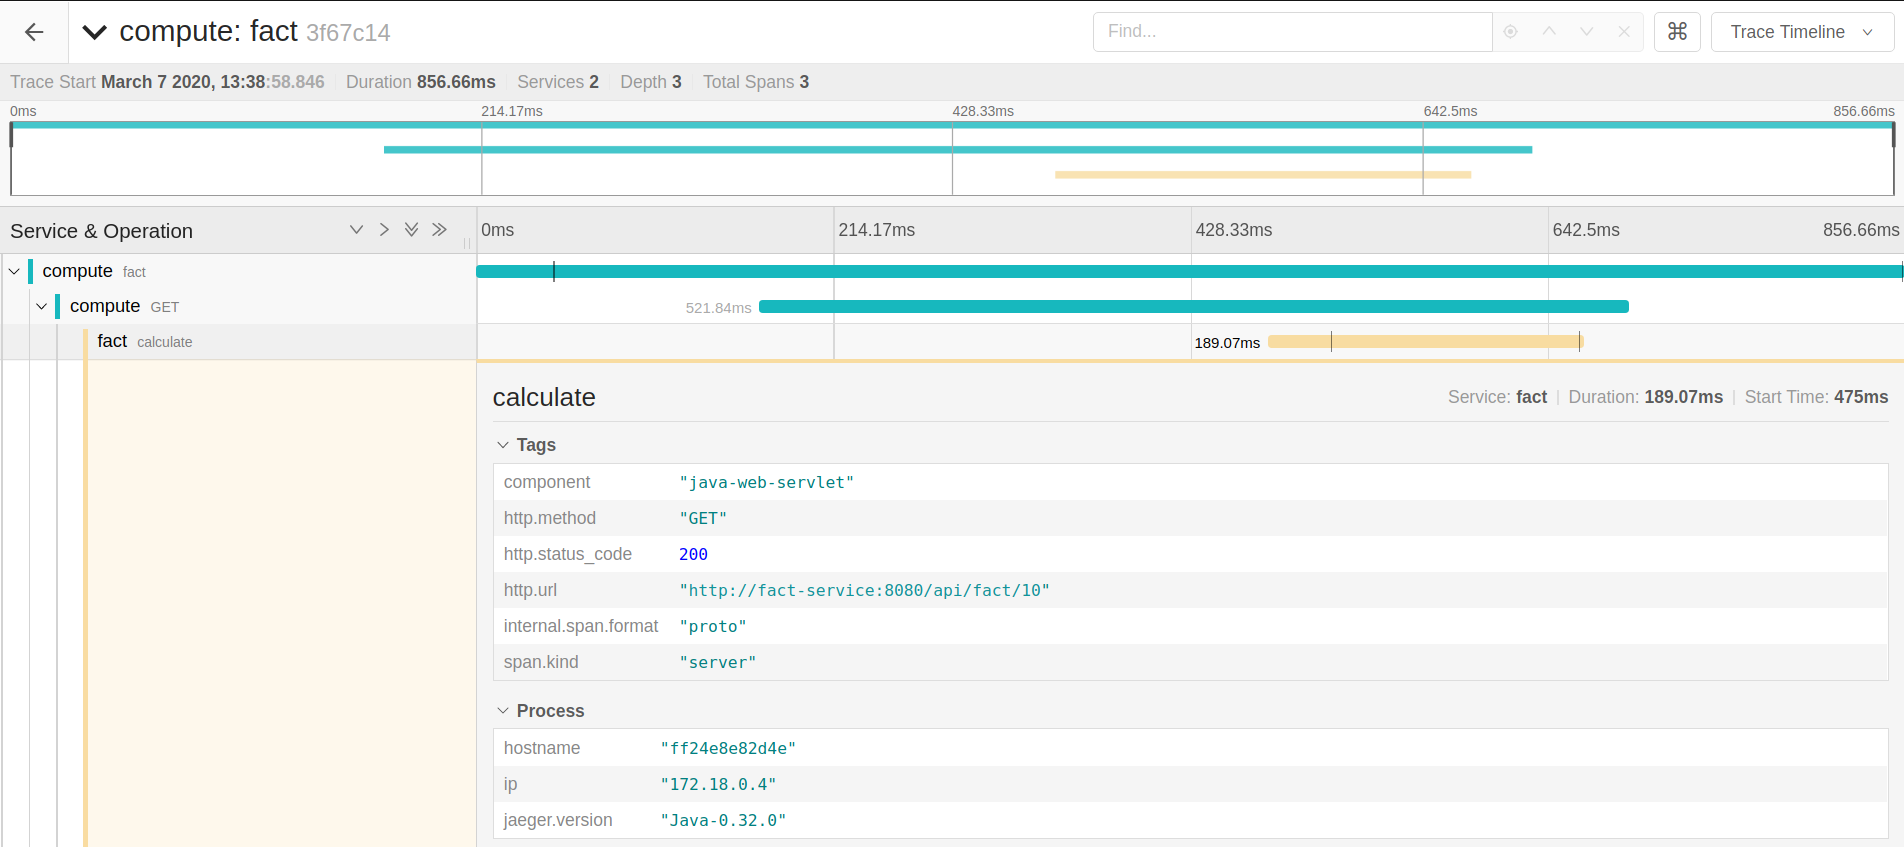
If we click on the successful fact request, We get more details about the request. when the request was received & when the compute-service internally called the fact-service etc.
Lets click on the fib request which failed. Here the compute-service internally called the fib-service. However the fib-service did not respond in time. So the request got timed out and failed.
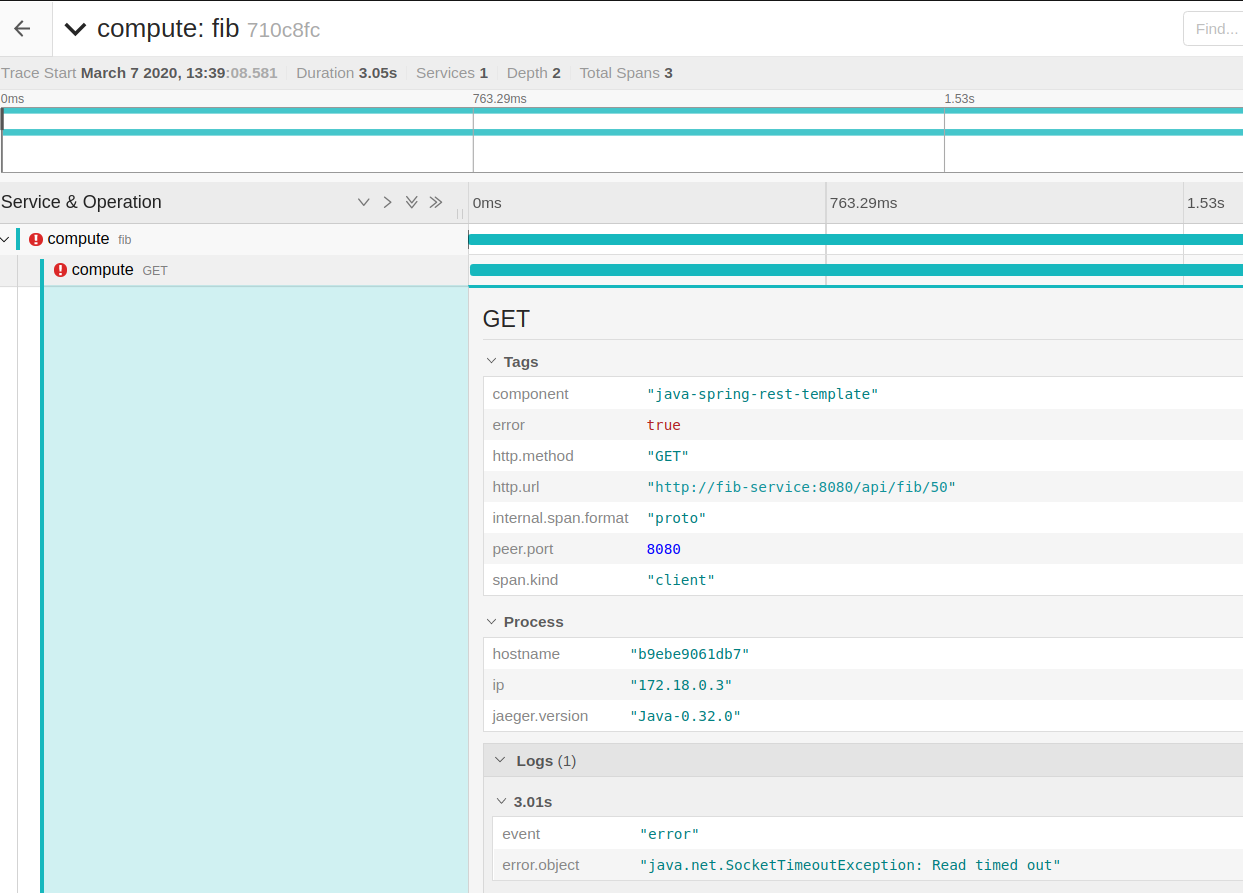
Note:
In my sample application implementation, I have intentionally used 2^N algorithm for fibonacci to make things slow. The rest template timeout is 3 seconds. So when the response is not received within 3 seconds, compute service will throw timeout exception.
Jaeger also shows a nice deep Service Dependency graph of our Microservices.
Summary:
We were able to successfully demonstrate Distributed Tracing In Microservices by using Jaeger With Spring Boot. Tracing requests in Microservice architectures where the request could span multiple Microservices is very challenging. Jaeger with Spring Boot makes that easy by adding a simple dependency in your application. Jaeger shows a nice UI which shows the details of each and every request and method calls which would be very helpful in debugging failed requests / monitoring application performance.
The complete working source code is here.
Learn more about Resilient Design Patterns In Microservices.
- Microservice Pattern – Retry Pattern
- Microservice Pattern – Circuit Breaker Pattern
- Microservices Design Patterns – Bulkhead Pattern
- Microservice Pattern – Rate Limiter Pattern
Happy learning 🙂
Good One!!
Thanks!